February 26, 2026 a 05:15 am
NI: Fibonacci Analysis - NiSource Inc.
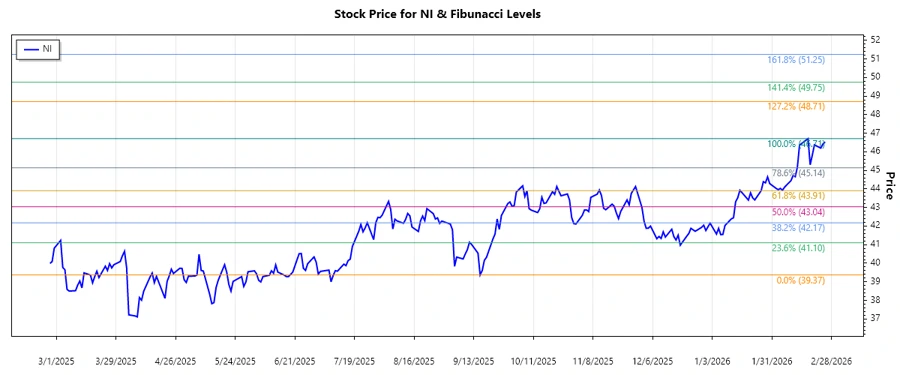
NiSource Inc., a key player in regulated natural gas and electric utility sectors in the U.S., has recently demonstrated an impressive uptrend in stock performance. The analysis of historical data reveals a strong upward momentum, highlighting the company’s robust position in its industry. As a utility provider, NiSource benefits from stable demand and regulatory frameworks, contributing to its steady financial performance. Investors should, however, remain cautious of potential market volatilities and regulatory changes that could impact future growth.
Fibonacci Analysis
| Details | Information |
|---|---|
| Trend Start Date | 2025-09-15 |
| Trend End Date | 2026-02-25 |
| High (Price/Date) | $46.71 / 2026-02-17 |
| Low (Price/Date) | $39.37 / 2025-09-16 |
| Fibonacci Level | Price Level |
|---|---|
| 0.236 | $41.30 |
| 0.382 | $42.83 |
| 0.5 | $43.98 |
| 0.618 | $45.14 |
| 0.786 | $46.49 |
The current price resides near the 0.618 retracement level, indicating potential support. If this level holds, it could be a promising entry point for bullish investors, signaling a possible continuation of the uptrend. If breached, it might indicate a shift in sentiment toward further retracement or a trend reversal.
Conclusion
NiSource Inc.'s recent market performance suggests strong bullish momentum, supported by stable business operations in the utility sector. The stock's current positioning near key Fibonacci levels indicates potential for continued growth, provided market conditions remain favorable. However, investors should heed potential risks, including regulatory shifts and market volatility, which could affect the stock's trajectory. By maintaining awareness of these factors, investors can better navigate potential opportunities and challenges in NiSource Inc.'s investment prospects.