September 12, 2025 a 06:44 am**NI: Fibonacci Analysis - NiSource Inc.**
 **Fibonacci Analysis**
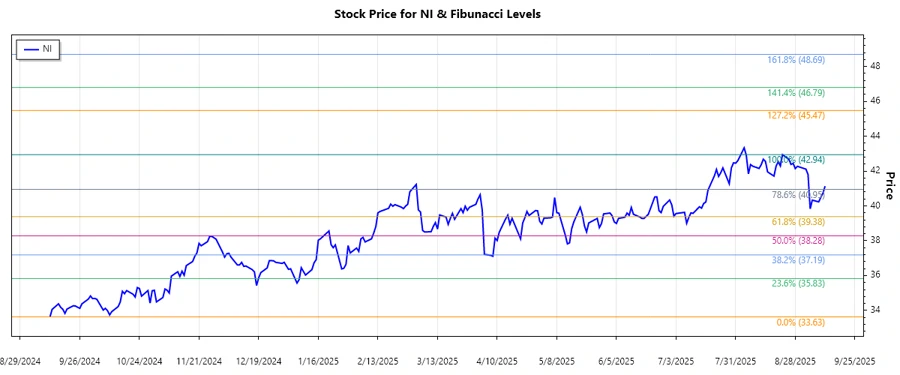
The analysis of NiSource Inc. reveals a dominant upward trend over the past few months. The following table showcases the detailed results of the Fibonacci retracement analysis.
**Fibonacci Analysis**
The analysis of NiSource Inc. reveals a dominant upward trend over the past few months. The following table showcases the detailed results of the Fibonacci retracement analysis.
 **Conclusion**
The stock of NiSource Inc. has displayed a strong upward movement, reflecting positive investor sentiment and robust business fundamentals. Despite current support at the 23.6% Fibonacci level, market volatility could influence fluctuations. A breakout above the recent high of $42.94 might indicate continued bullish momentum. However, failure to hold the current support level could trigger further retracement. This analysis offers valuable insights for technical analysts monitoring prospective investment returns in the natural gas and electric utility sector.
**Conclusion**
The stock of NiSource Inc. has displayed a strong upward movement, reflecting positive investor sentiment and robust business fundamentals. Despite current support at the 23.6% Fibonacci level, market volatility could influence fluctuations. A breakout above the recent high of $42.94 might indicate continued bullish momentum. However, failure to hold the current support level could trigger further retracement. This analysis offers valuable insights for technical analysts monitoring prospective investment returns in the natural gas and electric utility sector.
NiSource Inc., with operations as a regulated natural gas and electric utility provider, has shown an upward trend in its stock prices over the last few months. The trend reflects the company's robust business model and expansive customer base across various U.S. states. Investors should watch the Fibonacci retracement levels for potential support or resistance points in the coming months.
| Item | Description | ||||||||||||
|---|---|---|---|---|---|---|---|---|---|---|---|---|---|
| Start Date | 2024-12-12 | ||||||||||||
| End Date | 2025-09-11 | ||||||||||||
| High Point | 42.94 (2025-08-22) | ||||||||||||
| Low Point | 33.63 (2024-09-12) | ||||||||||||
| Fibonacci Levels |
|
||||||||||||
| Current Price | 41.13 | ||||||||||||
| Retracement Zone | 0.236 | ||||||||||||
| Interpretation | The current price is in the 23.6% retracement zone, indicating potential short-term support. |
**Conclusion**
The stock of NiSource Inc. has displayed a strong upward movement, reflecting positive investor sentiment and robust business fundamentals. Despite current support at the 23.6% Fibonacci level, market volatility could influence fluctuations. A breakout above the recent high of $42.94 might indicate continued bullish momentum. However, failure to hold the current support level could trigger further retracement. This analysis offers valuable insights for technical analysts monitoring prospective investment returns in the natural gas and electric utility sector.
Smart Data Insight
Master the Perfect Entry & Exit for this Stock
Don't leave your profits to chance. Historically, this stock follows specific seasonal patterns that institutional traders use to maximize returns.
- ✅ Identify the "Golden Buying Window"
- ✅ Avoid high-risk correction cycles
- ✅ Backtested data from the last 20+ years