
July 03, 2026 a 07:46 am

📊 NI: Dividend Analysis - NiSource Inc
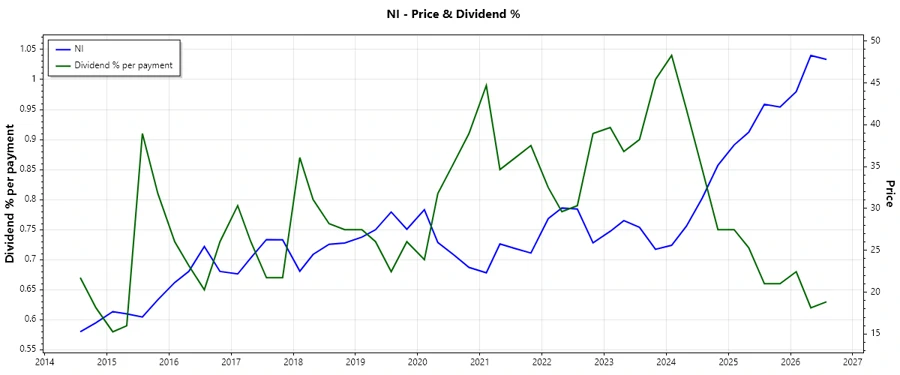
NiSource Inc presents a compelling dividend profile with a moderate yield and over four decades of dividend history. Despite facing challenges in free cash flow yield, the company has maintained a consistent dividend growth trend, supported by robust fundamentals and strategic financial management. This analysis explores the detailed aspects of NiSource's dividend dynamics to provide a comprehensive assessment for investors.
🗣️ Overview
NiSource Inc operates in the utilities sector, which is traditionally known for stable dividend-paying companies. With a current dividend yield of 2.47%, NiSource delivers a reasonable income to its investors. The firm’s commitment to maintaining dividends is reflected in its remarkable 42-year dividend history without any recent cuts or suspensions.
| Metric | Value |
|---|---|
| Sector | Utilities |
| Dividend yield | 2.47% |
| Current dividend per share | 1.12 USD |
| Dividend history | 42 years |
| Last cut or suspension | None |
📈 Dividend History
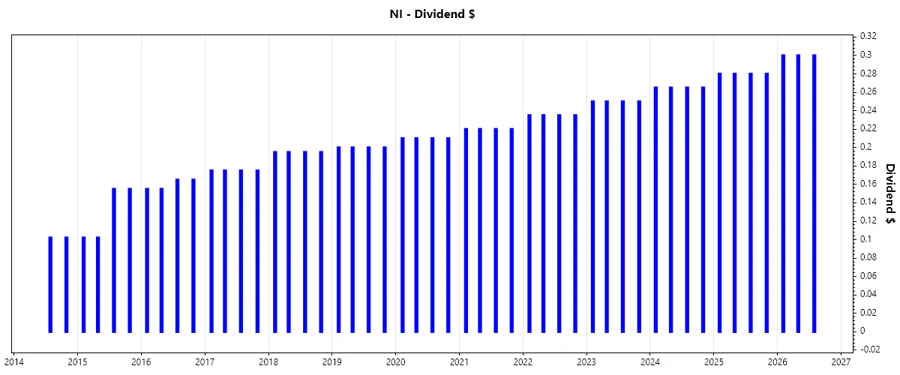
The historical consistency in NiSource's dividend payments underscores its commitment to providing reliable returns to shareholders. This record of consistent dividend payments is a critical factor for long-term income-focused investors.
| Year | Dividend per Share (USD) |
|---|---|
| 2026 | 0.90 |
| 2025 | 1.12 |
| 2024 | 1.06 |
| 2023 | 1.00 |
| 2022 | 0.94 |
📉 Dividend Growth
NiSource’s dividend growth pattern is indicative of its ability to incrementally enhance shareholder returns, leveraging its operational efficiencies and strategic planning. Examining the growth metrics allows investors to gauge future potential returns.
| Time | Growth |
|---|---|
| 3 years | 6.01% |
| 5 years | 5.92% |
The average dividend growth is 5.92% over 5 years. This shows moderate but steady dividend growth.
✅ Payout Ratio
Payout ratios are crucial for assessing the sustainability of dividends. They inform us about the proportion of earnings and free cash flow used to pay dividends, which reflects financial health.
| Key figure | Ratio |
|---|---|
| EPS-based | 55.86% |
| Free cash flow-based | -64.63% |
The EPS-based payout ratio of 55.86% is sustainable, while the negative FCF-based ratio indicates potential cash flow management challenges.
💼 Cashflow & Capital Efficiency
Cash flow analysis provides insights into the company's ability to generate sustainable cash flows relative to its operating performance and capital expenditures. These metrics are vital for assessing the financial strength and operational efficiency.
| Metric | 2025 | 2024 | 2023 |
|---|---|---|---|
| Free Cash Flow Yield | -2.13% | -5.16% | -6.43% |
| Earnings Yield | 4.71% | 4.55% | 6.47% |
| CAPEX to Operating Cash Flow | 139.28% | 148.36% | 136.73% |
| Stock-based Compensation to Revenue | 0% | 0.59% | 0.43% |
| Free Cash Flow / Operating Cash Flow Ratio | -17.78% | -48.36% | -36.73% |
The negative free cash flow yield and high CAPEX suggest constraints on cash flow management, impacting capital efficiency assessments.
📊 Balance Sheet & Leverage Analysis
Evaluating leverage ratios and balance sheet metrics is essential to understand the company's financial stability, debt structure, and liquidity position. A sound balance sheet is critical to sustaining dividends over time.
| Metric | 2025 | 2024 | 2023 |
|---|---|---|---|
| Debt-to-Equity | 171.85% | 160.76% | 170.84% |
| Debt-to-Assets | 44.43% | 43.92% | 45.46% |
| Debt-to-Capital | 63.22% | 61.65% | 63.08% |
| Net Debt to EBITDA | 5.35 | 5.37 | 5.34 |
| Current Ratio | 0.65 | 0.51 | 0.85 |
| Quick Ratio | 0.56 | 0.41 | 0.76 |
| Financial Leverage | 3.87 | 3.66 | 3.76 |
NiSource's leverage ratios suggest a high debt burden, but the company's ability to cover interest is adequate for maintaining financial stability.
🌟 Fundamental Strength & Profitability
Analyzing profitability and fundamental strength showcases NiSource's efficiency in generating returns relative to its assets and equity, providing insights into its operational prowess.
| Metric | 2025 | 2024 | 2023 |
|---|---|---|---|
| Return on Equity | 9.84% | 8.75% | 8.64% |
| Return on Assets | 2.54% | 2.39% | 2.30% |
| Margins: Net | 13.99% | 13.94% | 12.97% |
| Margins: Gross | 58.57% | 51.47% | 44.99% |
| Research & Development to Revenue | 0% | 0% | 0% |
NiSource's optimal margins and consistent returns on equity and assets denote a robust operational framework critical for sustained profitability.
🔍 Price Development
📊 Dividend Scoring System
| Criteria | Score | Bar |
|---|---|---|
| Dividend yield | 3 | |
| Dividend Stability | 5 | |
| Dividend growth | 4 | |
| Payout ratio | 4 | |
| Financial stability | 3 | |
| Dividend continuity | 5 | |
| Cashflow Coverage | 2 | |
| Balance Sheet Quality | 3 |
Total Score: 29/40
⭐ Rating
Based on the comprehensive analysis, NiSource Inc is rated as a strong dividend performer with robust stability and consistent historical growth. However, potential investors should consider its challenges in free cash flow and leverage, which could affect future payout capabilities. The stock is recommended for income-seeking investors with a focus on long-term stable returns in the utilities sector.
Smart Data Insight
Master the Perfect Entry & Exit for this Stock
Don't leave your profits to chance. Historically, this stock follows specific seasonal patterns that institutional traders use to maximize returns.
- ✅ Identify the "Golden Buying Window"
- ✅ Avoid high-risk correction cycles
- ✅ Backtested data from the last 20+ years