February 08, 2026 a 03:31 pm

NI: Dividend Analysis - NiSource Inc.
NiSource Inc., operating in the energy sector, showcases a promising dividend profile with a substantial history of consistent payments and growth. The company’s strategy reflects a commitment to long-term shareholder value through stable and sustainable returns. Despite the recent fluctuations in earnings, the dividend policy remains robust, offering investors a blend of security and progressive growth.
📊 Overview
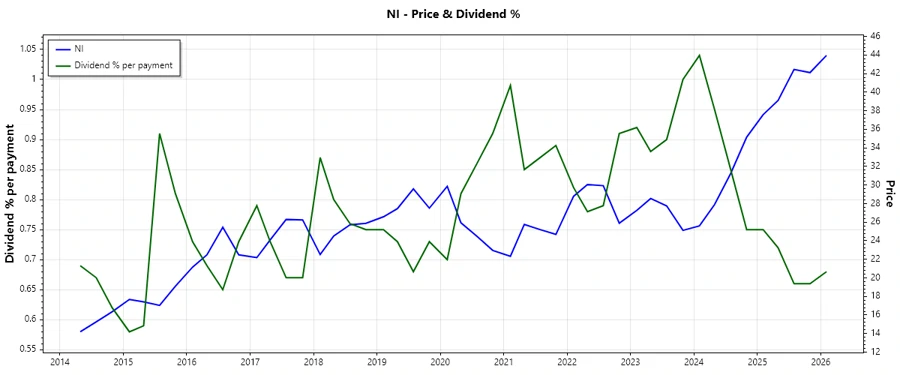
NiSource Inc. belongs to the energy sector, known for its resilience and defensive characteristics. The company offers a dividend yield of 2.59%, with a current dividend per share of 1.08 USD, indicating a solid return for investors. Leveraging its 42-year dividend history without any recent cuts, the company underscores its commitment to rewarding shareholders.
| Sector | Dividend Yield | Current Dividend Per Share | Dividend History | Last Cut/Suspension |
|---|---|---|---|---|
| Energy | 2.59% | 1.08 USD | 42 years | None |
📈 Dividend History
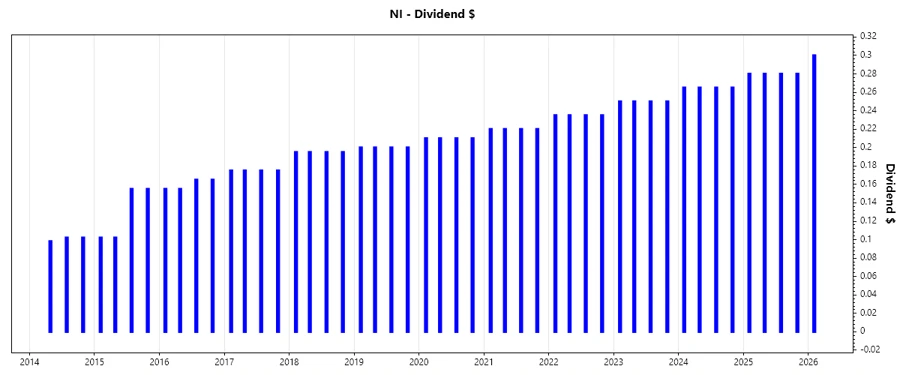
The historical dividend payouts of NiSource Inc. reveal a strong commitment to maintaining stability and growth, crucial for attracting dividend-focused investors. A rich history of consecutive payments underscores investor confidence.
| Year | Dividend Per Share |
|---|---|
| 2026 | 0.30 USD |
| 2025 | 1.12 USD |
| 2024 | 1.06 USD |
| 2023 | 1.00 USD |
| 2022 | 0.94 USD |
📈 Dividend Growth
Dividend growth is a crucial indicator of a company's capacity to increase shareholder returns over time. NiSource Inc. demonstrates a moderate but promising growth trajectory, highlighting its ability to enhance investor value.
| Time | Growth |
|---|---|
| 3 years | 6.01% |
| 5 years | 5.92% |
The average dividend growth is 5.92% over 5 years. This shows moderate but steady dividend growth.
💡 Payout Ratio
Evaluating payout ratios is essential to ensure a company's ability to sustain dividend payments. NiSource Inc.’s EPS-based payout ratio stands at 56.78%, suggesting a well-covered dividend out of earnings.
| Key Figure | Ratio |
|---|---|
| EPS-based | 56.78% |
| Free Cash Flow-based | -95.18% |
The EPS payout ratio of 56.78% is manageable, indicating healthy coverage by earnings, while the FCF-based ratio of -95.18% requires improvement to ensure dividend sustainability.
🚀 Cashflow & Capital Efficiency
Examining cash flow trends and capital efficiency is instrumental in determining a company's financial health and investment capabilities.
| Year | 2022 | 2023 | 2024 |
|---|---|---|---|
| Free Cash Flow Yield | -0.071 | -0.064 | -0.052 |
| Earnings Yield | 0.072 | 0.065 | 0.046 |
| CAPEX to Operating Cash Flow | 1.563 | 1.367 | 1.484 |
| Stock-based Compensation to Revenue | 0.0043 | 0.0043 | 0.0059 |
| Free Cash Flow / Operating Cash Flow Ratio | -0.563 | -0.367 | -0.484 |
Current metrics indicate challenged cash flow positivity, yet NiSource’s consistent capital investment suggests proactive long-term growth strategies.
🏦 Balance Sheet & Leverage Analysis
A strong balance sheet supports the company’s operational continuity and ability to withstand financial adversities effectively.
| Year | 2022 | 2023 | 2024 |
|---|---|---|---|
| Debt-to-Equity | 1.52 | 1.71 | 1.61 |
| Debt-to-Assets | 0.43 | 0.45 | 0.44 |
| Debt-to-Capital | 0.60 | 0.63 | 0.62 |
| Net Debt to EBITDA | 5.34 | 5.34 | 5.37 |
| Current Ratio | 0.55 | 0.85 | 0.51 |
| Quick Ratio | 0.39 | 0.76 | 0.41 |
| Financial Leverage | 3.53 | 3.76 | 3.66 |
NiSource's leverage ratios reflect a significant use of debt, which requires careful management to sustain financial flexibility and safeguard equity holders.
📊 Fundamental Strength & Profitability
Core profitability metrics reveal insights into operational effectiveness and value creation.
| Year | 2022 | 2023 | 2024 |
|---|---|---|---|
| Return on Equity | 10.61% | 8.64% | 8.76% |
| Return on Assets | 3.01% | 2.30% | 2.39% |
| Net Margin | 13.74% | 12.97% | 13.94% |
| EBIT Margin | 22.71% | 23.89% | 27.97% |
| EBITDA Margin | 36.74% | 40.38% | 47.10% |
| Gross Margin | 38.47% | 44.99% | 51.47% |
| R&D to Revenue | 0.00% | 0.00% | 0.00% |
Solid profitability metrics reveal NiSource's ability to generate returns from its operations, although the lack of R&D investment hints at limited innovation or growth expansion activities.
📈 Dividend Scoring System
The dividend scoring system evaluates key attributes influencing dividend sustainability.
| Criteria | Score | Indicator |
|---|---|---|
| Dividend Yield | 3 | |
| Dividend Stability | 5 | |
| Dividend Growth | 4 | |
| Payout Ratio | 3 | |
| Financial Stability | 3 | |
| Dividend Continuity | 5 | |
| Cashflow Coverage | 2 | |
| Balance Sheet Quality | 3 |
Total Score: 28/40
🗣️ Rating
NiSource Inc. maintains a solid dividend profile, reinforced by a stable payout track record and moderate growth. While there are opportunities to strengthen cash flow and financial stability, the current dividend policy aligns well with shareholder expectations. Investors seeking consistent income coupled with growth potential may find NiSource to be a viable long-term investment.
Smart Data Insight
Master the Perfect Entry & Exit for this Stock
Don't leave your profits to chance. Historically, this stock follows specific seasonal patterns that institutional traders use to maximize returns.
- ✅ Identify the "Golden Buying Window"
- ✅ Avoid high-risk correction cycles
- ✅ Backtested data from the last 20+ years