November 04, 2025 a 03:31 am
NI: Dividend Analysis - NiSource Inc.
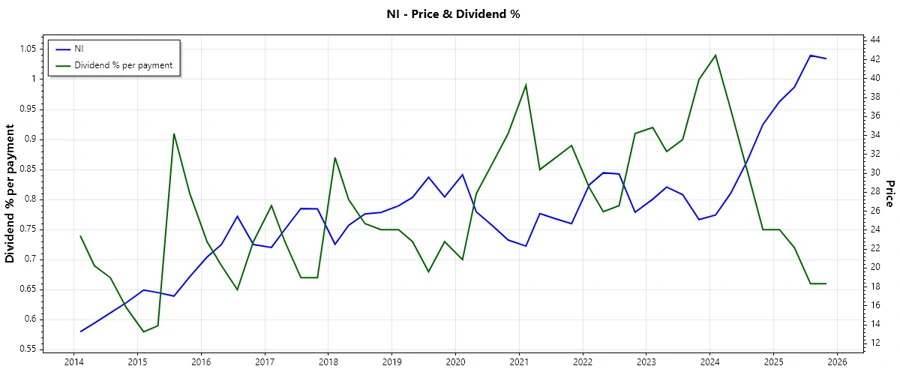
🗣️ NiSource Inc. is a prominent utility holding company with a solid track record of dividend payments. With an extensive history of 41 consecutive years of dividend payouts, it exhibits strong reliability for income-focused investors. Although slightly below the broader market, the dividend yield of 2.66% remains attractive, indicating steady investor income. Realizing a dividend growth rate of approximately 6.40% over the past three years, NiSource demonstrates consistent upward momentum in its dividend policies. Investors will appreciate the low volatility in dividend payouts except for a minor dip back in 2013 caused by macroeconomic conditions.
Overview
📊NiSource operates within the Utilities Sector, a generally steady and predictable industry. This stability is reflected in their consistent dividend profile, making it a staple for risk-averse investors.
| Sector | Dividend Yield | Current Dividend per Share (USD) | Dividend History | Last Cut or Suspension |
|---|---|---|---|---|
| Utilities | 2.66% | 1.08 | 41 years | 2013 |
Dividend History
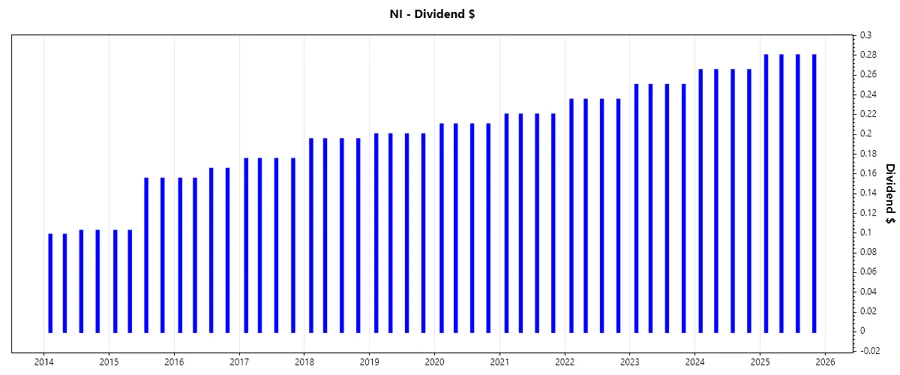
📜🔍 NiSource's track record speaks volumes with 41 years of uninterrupted dividends, reflecting a robust commitment to shareholder returns. This trustworthy history creates a dependable income stream. Historical data is crucial as it shows the company's adaptation to economic changes.
| Year | Dividend per Share (USD) |
|---|---|
| 2025 | 1.12 |
| 2024 | 1.06 |
| 2023 | 1.00 |
| 2022 | 0.94 |
| 2021 | 0.88 |
Dividend Growth
🚀📈 The growth rate for NiSource in dividends over the last 3 and 5 years illustrates modest but steady improvements, vital for predicting future income. This stability supports a safe return option amidst volatile market conditions.
| Time | Growth |
|---|---|
| 3 years | 6.40% |
| 5 years | 5.79% |
🧐 The average dividend growth is 5.79% over 5 years. This shows moderate but steady dividend growth, appealing to investors seeking reliable income growth.
Payout Ratio
🔗🔍 NiSource's payout ratios are key indicators of its ability to sustain dividends. The EPS-based payout ratio stands at 56.78%, illustrating a balanced participation of earnings devoted to dividends. However, the negative FCF-based ratio indicates challenges due to current cash flow difficulties.
| Key Figure | Ratio |
|---|---|
| EPS-based | 56.78% |
| Free cash flow-based | -94.63% |
⚠️ The EPS payout ratio is acceptable, but the negative FCF ratio highlights current cash flow constraints, warranting close investor scrutiny.
Cashflow & Capital Efficiency
🔍The company's capital efficiency profile highlights its strategic allocation of operating cash flow. A rising CAPEX to operating cash flow ratio emphasizes noteworthy reinvestment strategies, underlying potential growth prospects. Meanwhile, other metrics are invitingly crucial for understanding fiscal health, particularly for cash-centric investors.
| Metric | 2024 | 2023 | 2022 |
|---|---|---|---|
| Free Cash Flow Yield | -5.16% | -6.43% | -7.11% |
| Earnings Yield | 4.55% | 6.47% | 7.20% |
| CAPEX to Operating Cash Flow | 1.48 | 1.37 | 1.56 |
| Stock-based Compensation to Revenue | 0.59% | 0.43% | 0.43% |
| Free Cash Flow / Operating Cash Flow Ratio | -48.36% | -36.73% | -56.31% |
🧐 The current negative Free Cash Flow Yield poses a challenge, but ongoing CAPEX investments signify long-term growth potential. Monitoring this aspect is critical as it can influence future capital returns.
Balance Sheet & Leverage Analysis
🔍The liability profile provides insight into NiSource's leverage, highlighting pertinent areas like Debt-to-Equity and Net Debt to EBITDA, crucial for deducing financial stabilization strategies. Analysis reveals a reasonably stable balance sheet though existing leverage deserves caution.
| Metric | 2024 | 2023 | 2022 |
|---|---|---|---|
| Debt-to-Equity | 1.61 | 1.71 | 1.52 |
| Debt-to-Assets | 0.44 | 0.45 | 0.43 |
| Debt-to-Capital | 0.62 | 0.63 | 0.60 |
| Net Debt to EBITDA | 5.39 | 5.34 | 5.34 |
| Current Ratio | 0.52 | 0.85 | 0.55 |
| Quick Ratio | 0.41 | 0.76 | 0.39 |
| Financial Leverage | 3.66 | 3.76 | 3.53 |
🧐 While leverage remains relatively high, efforts addressing these areas could significantly enhance financial stability over time. Investors should watch for improvements in debt figures.
Fundamental Strength & Profitability
🔍Analyzing key profitability metrics reveals solid operational performance, emphasizing important ratios like ROE and Net Profit margin. These are essential in assessing overall fiscal health and profitability strength.
| Metric | 2024 | 2023 | 2022 |
|---|---|---|---|
| Return on Equity | 8.76% | 8.64% | 10.61% |
| Return on Assets | 2.39% | 2.30% | 3.01% |
| Net Margin | 13.94% | 12.97% | 13.74% |
| EBIT Margin | 27.97% | 23.89% | 22.71% |
| EBITDA Margin | 47.10% | 40.38% | 36.74% |
| Gross Margin | 51.47% | 44.99% | 38.47% |
| Research & Development to Revenue | 0% | 0% | 0% |
🕵️♂️ These profitability metrics showcase NiSource's solid footing, although areas like R&D investments may noticeably lag behind peers.
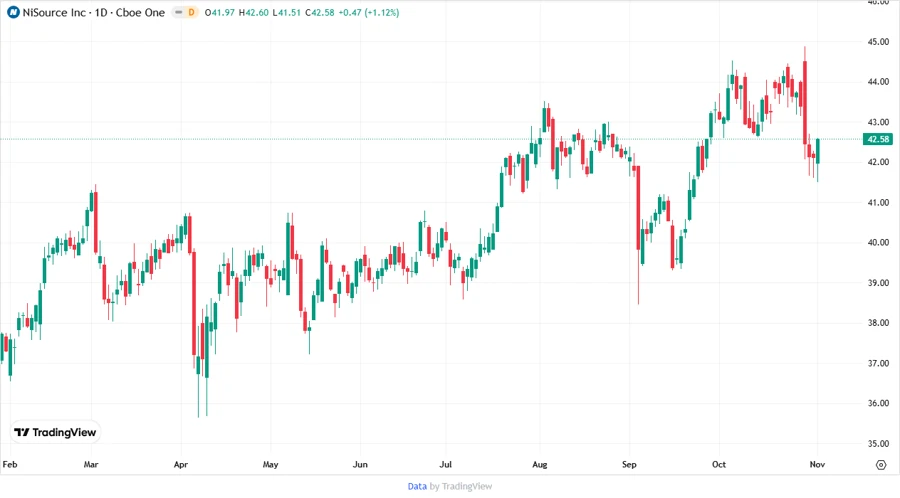
Price Development
📈
Dividend Scoring System
📏| Category | Score | |
|---|---|---|
| Dividend Yield | 3 | |
| Dividend Stability | 5 | |
| Dividend Growth | 4 | |
| Payout Ratio | 3 | |
| Financial Stability | 3 | |
| Dividend Continuity | 5 | |
| Cashflow Coverage | 2 | |
| Balance Sheet Quality | 3 |
Total Score: 28/40
Rating
📊✅ NiSource Inc. receives a solid rating given its stable dividends, supported by a long history of payouts. The moderate dividend growth, in conjunction with manageable payout ratios, secures its place as a sound choice for income investors. The firm presents average financial stability but remains a reliable utility sector choice due to strong dividend continuity and predictable revenue streams.
Smart Data Insight
Master the Perfect Entry & Exit for this Stock
Don't leave your profits to chance. Historically, this stock follows specific seasonal patterns that institutional traders use to maximize returns.
- ✅ Identify the "Golden Buying Window"
- ✅ Avoid high-risk correction cycles
- ✅ Backtested data from the last 20+ years