October 18, 2025 a 03:31 pm
NI: Dividend Analysis - NiSource Inc.
NiSource Inc., a major player in the utilities sector, showcases a robust dividend profile complemented by a solid history of continuous payouts. With a 41-year track record of dividend payments, it stands out for its resilience. The company's strategic approaches over these years have built a stable dividend yield, although recent cash flow challenges merit close monitoring by investors.
Overview 📊
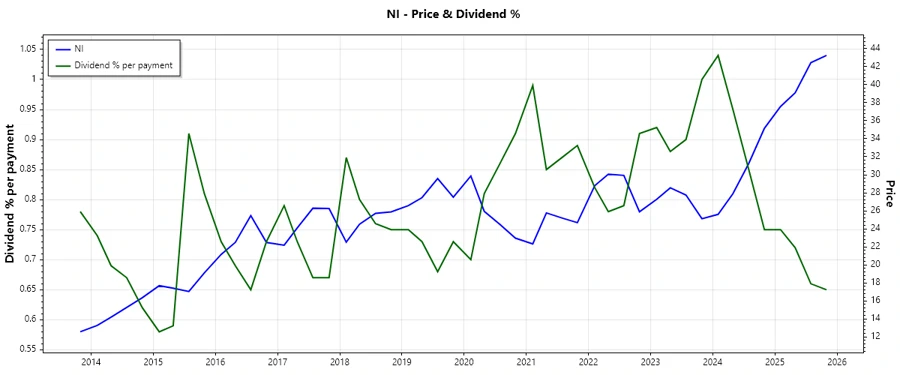
NiSource Inc., within the utility sector, emanates stability with a consistent dividend yield at 2.59%. An attractive proposition for dividend-seeking investors is its resilient 41-year track record of uninterrupted dividend history, a testament to its robust business model and commitment to returning capital to its shareholders. The last instance of cut or suspension was notably in 2013.
| Key Metrics | Details |
|---|---|
| Sector | Utilities |
| Dividend Yield | 2.59% |
| Current Dividend per Share | 1.08 USD |
| Dividend History | 41 years |
| Last Cut or Suspension | 2013 |
Dividend History 🗣️
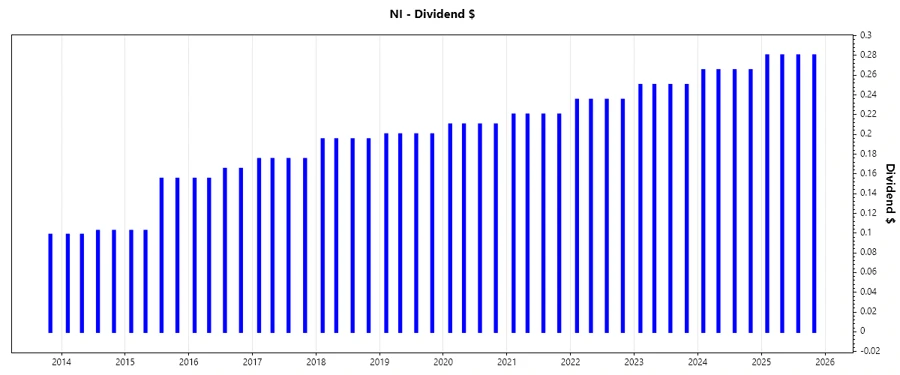
The dividend history of NiSource Inc. illustrates a strong commitment to shareholder returns, highlighted by consistent yearly increases, reflecting its financial health and profit-generation capabilities. This stability is critical, especially in the utility sector where income is vital.
| Year | Dividend per Share (USD) |
|---|---|
| 2025 | 1.12 |
| 2024 | 1.06 |
| 2023 | 1.00 |
| 2022 | 0.94 |
| 2021 | 0.88 |
Dividend Growth 📈
Analyzing NiSource Inc.'s dividend growth indicates a compound annual growth rate of 6.40% over the last three years and 5.79% over five years. Such growth rates reflect a moderate but steady increase in shareholder returns, which is crucial for long-term financial planning and stability.
| Time | Growth |
|---|---|
| 3 years | 6.40% |
| 5 years | 5.79% |
The average dividend growth is 5.79% over 5 years. This shows moderate but steady dividend growth.
Payout Ratio ✅
The payout ratios for NiSource Inc. are a critical metric reflecting financial health. An EPS payout ratio of 57.22% suggests a balanced approach, while the FCF payout ratio of -77.12% indicates potential liquidity issues stemming from the cash flow. Strategic financial management is necessary to address this disparity and maintain dividend sustainability.
| Key Figure | Ratio |
|---|---|
| EPS-based | 57.22% |
| Free cash flow-based | -77.12% |
The balanced EPS payout ratio suggests sustainability, whereas the negative FCF ratio requires careful attention to avoid future liquidity constraints.
Cashflow & Capital Efficiency 📉
Understanding cash flow metrics like Free Cash Flow Yield and CAPEX to Operating Cash Flow is fundamental in evaluating liquidity and capital utilization. NiSource Inc. shows challenges with a negative cash flow yield and higher CAPEX, indicating potential reinvestment or liquidity risks.
| Year | 2022 | 2023 | 2024 |
|---|---|---|---|
| Free Cash Flow Yield | -7.11% | -6.43% | -5.16% |
| Earnings Yield | 7.20% | 6.47% | 4.55% |
| CAPEX to Operating Cash Flow | 1.56 | 1.37 | 1.48 |
| Stock-based Compensation to Revenue | 0.004 | 0.004 | 0.006 |
| Free Cash Flow / Operating Cash Flow Ratio | -0.56 | -0.37 | -0.48 |
The declining free cash flow figures indicate stress in cash management, necessitating strategic interventions to protect capital efficiency and shareholder returns.
Balance Sheet & Leverage Analysis 📊
Balance sheet stability is crucial for long-term sustainability. NiSource's high leverage ratios suggest significant reliance on debt, which is generally inherent to utilities but requires close risk monitoring to avoid solvency issues.
| Year | 2022 | 2023 | 2024 |
|---|---|---|---|
| Debt-to-Equity | 1.52 | 1.71 | 1.61 |
| Debt-to-Assets | 0.43 | 0.45 | 0.44 |
| Debt-to-Capital | 0.60 | 0.63 | 0.62 |
| Net Debt to EBITDA | 5.34 | 5.34 | 5.37 |
| Current Ratio | 0.55 | 0.85 | 0.51 |
| Quick Ratio | 0.39 | 0.76 | 0.41 |
| Financial Leverage | 3.53 | 3.76 | 3.66 |
While manageable, the heightened leverage implies that NiSource must maintain sufficient earnings to cover these obligations and avoid financial distress.
Fundamental Strength & Profitability 🏆
Profitability metrics provide insights into operational efficiency. With stable margins, NiSource maintains a balanced profitability, but should aim for improvements to bolster financial resilience.
| Year | 2022 | 2023 | 2024 |
|---|---|---|---|
| Return on Equity (ROE) | 10.61% | 8.64% | 8.76% |
| Return on Assets (ROA) | 3.01% | 2.30% | 2.39% |
| Margins: Net | 13.74% | 12.97% | 13.94% |
| Margins: EBIT | 22.71% | 23.88% | 27.97% |
| Margins: EBITDA | 36.74% | 40.38% | 47.10% |
| Margins: Gross | 38.47% | 44.99% | 51.47% |
| R&D to Revenue | 0.00% | 0.00% | 0.00% |
While profitability is intact, optimization of margins is advised for enhancing competitive edge in the utilities landscape.
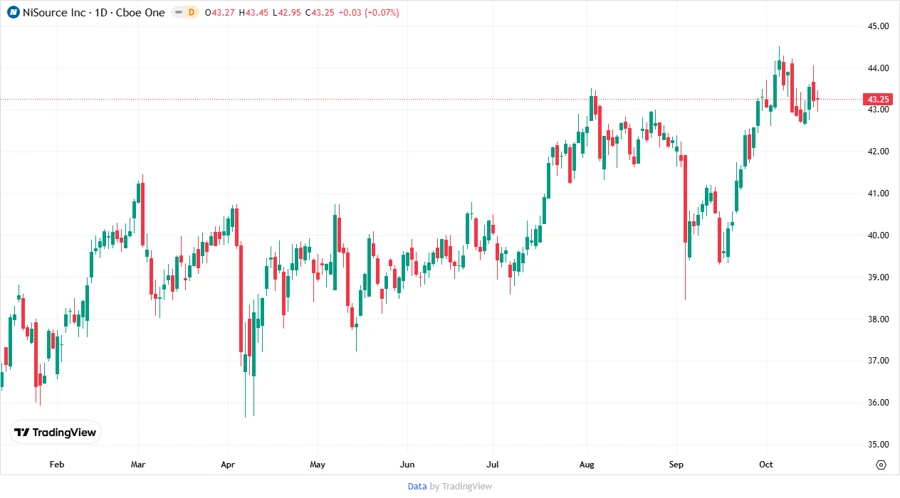
Price Development 💹
Dividend Scoring System 🏅
An analysis of NiSource Inc. relies on a scoring system, evaluating multiple facets to provide a nuanced perspective on its dividend viability and overall financial health.
| Criteria | Score (1-5) | Score Bar |
|---|---|---|
| Dividend Yield | 3 | |
| Dividend Stability | 5 | |
| Dividend Growth | 4 | |
| Payout Ratio | 3 | |
| Financial Stability | 2 | |
| Dividend Continuity | 5 | |
| Cashflow Coverage | 2 | |
| Balance Sheet Quality | 3 |
Overall: 27/40
Rating 🏆
NiSource Inc. holds a promising position in the dividend landscape, reinforced by a commendable dividend history and stability. However, prospects are challenged by cash flow dynamics and a high debt profile, indicating the need for vigilant financial strategy execution. Investors can consider NiSource as a steady dividend player, but strategic monitoring is advised given existing fiscal pressures.
Smart Data Insight
Master the Perfect Entry & Exit for this Stock
Don't leave your profits to chance. Historically, this stock follows specific seasonal patterns that institutional traders use to maximize returns.
- ✅ Identify the "Golden Buying Window"
- ✅ Avoid high-risk correction cycles
- ✅ Backtested data from the last 20+ years