March 24, 2026 a 11:44 am
NFLX: Fibonacci Analysis - Netflix, Inc.
Netflix, Inc. has experienced notable fluctuations in stock price over the recent months. The company's continuous expansion into international markets and diversification of its content offering continue to be significant growth drivers. However, competition within the streaming industry remains fierce, which may impact its market position. Despite these challenges, Netflix's vast subscriber base and innovations in content production offer promising long-term potential.
Fibonacci Analysis
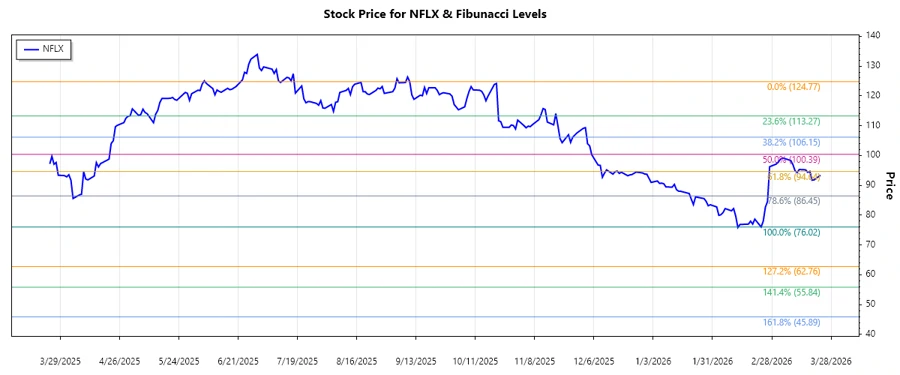
Based on the historical data, we have identified a dominant downtrend from late 2025 to the start of 2026. This trend is crucial for projecting potential Fibonacci retracement levels, where investors may anticipate reversal points.
| Start Date | End Date | High Price | Low Price |
|---|---|---|---|
| 2025-10-08 | 2026-03-23 | $124.77 | $76.02 |
| Fibonacci Level | Price Level |
|---|---|
| 0.236 | $87.56 |
| 0.382 | $96.92 |
| 0.5 | $100.39 |
| 0.618 | $103.86 |
| 0.786 | $114.61 |
The current price of $93.38 is in the 0.236 to 0.382 retracement zone. This suggests potential resistance around the 0.382 level, where a reversal could occur.
Technically, this area can act as a resistance point, potentially limiting upward movements and offering a challenging environment for bullish advancements.
Conclusion
The recent downtrend observed in Netflix's stock may showcase the compelling attributes of Fibonacci retracement analysis. The data suggests resistance at certain retracement levels, where the price may face difficulty breaking through. This analysis helps analysts anticipate potential reversal points, guiding strategic decision-making. Although short-term resistance is apparent, Netflix's strategic expansions and content innovations could bode well for long-term growth prospects. Nevertheless, continued monitoring of market competition and content performance is essential for sustained success. Analysts should weigh both external market challenges and Netflix's internal strengths when assessing investment potential.