February 11, 2026 a 10:15 am
NFLX: Fibonacci Analysis - Netflix, Inc.
Netflix, Inc. remains a leader in streaming services, significantly impacting global entertainment. With a vast subscriber base and constantly evolving content strategy, its stock performance is closely watched by investors. Recent volatility might offer opportunities for savvy investors to capitalize on price movements in the wake of shifting market conditions.
Fibonacci Analysis
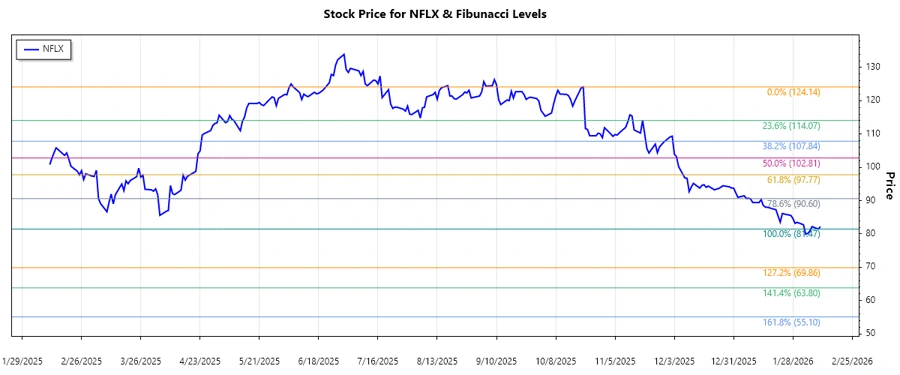
The following analysis details the recent downtrend in Netflix's stock, identifying critical Fibonacci retracement levels which may serve as potential support or resistance.
| Detail | Information |
|---|---|
| Trend Type | Downtrend |
| Start Date | 2025-10-21 |
| End Date | 2026-02-10 |
| High Point | 124.14 on 2025-10-21 |
| Low Point | 81.47 on 2026-02-09 |
| Fibonacci Levels |
|
| Current Price | $82.21 |
| Retracement Zone | None |
| Interpretation | The current price is below the 0.236 retracement level, indicating potential further downside unless a reversal occurs. |
Conclusion
Netflix, Inc. is currently facing a downtrend, which might present a challenging environment for bullish investors. While the current price is notably below significant Fibonacci levels, it suggests the bears maintain control. Careful monitoring for signs of a reversal is recommended, especially if prices break through higher resistance levels. The primary risk is further declines if no reversal signal appears, whereas potential gains could materialize if strategic support levels hold.