September 27, 2025 a 05:15 am
NFLX: Fibonacci Analysis - Netflix, Inc.
Netflix, Inc. continues to showcase strong performance, maintaining its position as a leader in the entertainment sector. Despite ongoing competition, Netflix's vast subscriber base and innovative content strategies enhance its market potential. However, fluctuating global economic conditions and increased content production costs might present challenges. Investors should monitor how Netflix adapts to these factors in the coming months.
Fibonacci Analysis
| Attribute | Details |
|---|---|
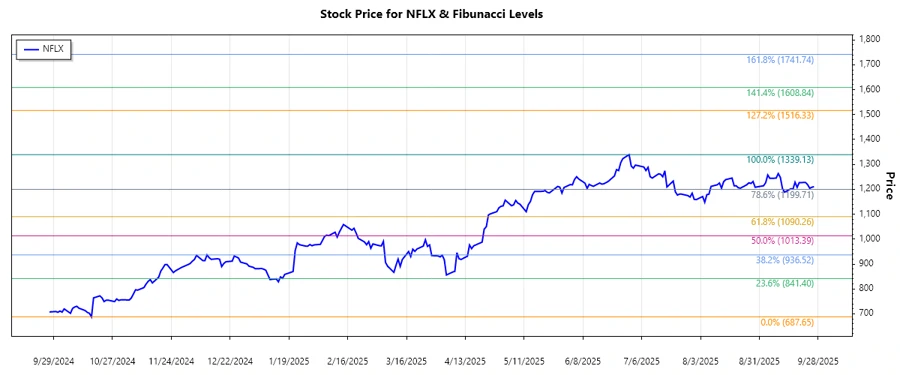
| Trend Start Date | 2024-10-17 |
| Trend End Date | 2025-06-30 |
| High Price | $1339.13 (on 2025-06-30) |
| Low Price | $687.65 (on 2024-10-17) |
| Fibonacci Level | Price Level |
|---|---|
| 0.236 | $887.46 |
| 0.382 | $978.56 |
| 0.5 | $1013.39 |
| 0.618 | $1048.23 |
| 0.786 | $1141.98 |
As of now, the current price is $1210.61, which positions it above the 0.786 retracement level. This suggests that the stock is in a continuation phase, moving upwards beyond previous resistance. Technically, this can be interpreted as a strong bullish sign, indicating potential further upside momentum.
Conclusion
Netflix, Inc.'s stock has demonstrated a robust uptrend, which may continue if the momentum persists. The current price surpasses important Fibonacci levels, indicating bullish sentiment. However, investors should be cautious of any macroeconomic fluctuations and sector-specific challenges, such as increasing competition. With a solid content portfolio and a growing subscriber base, Netflix remains a formidable player in the entertainment industry, though strategic adaptations will be key to sustaining growth.
Smart Data Insight
Master the Perfect Entry & Exit for this Stock
Don't leave your profits to chance. Historically, this stock follows specific seasonal patterns that institutional traders use to maximize returns.
- ✅ Identify the "Golden Buying Window"
- ✅ Avoid high-risk correction cycles
- ✅ Backtested data from the last 20+ years