August 25, 2025 a 10:15 am

NFLX: Fibonacci Analysis - Netflix, Inc.
Netflix, Inc. has demonstrated resilience in a competitive streaming market, with its vast content library and original productions driving user engagement. Recent financial performance has shown promising trends, despite market volatility affecting the broader tech sector. Investors should weigh the company's growth strategies in emerging markets alongside challenges such as increased competition and regulatory scrutiny.
Fibonacci Analysis
| Start Date | End Date | High Price | High Date | Low Price | Low Date | Current Price |
|---|---|---|---|---|---|---|
| 2024-08-26 | 2025-06-30 | $1339.13 | 2025-06-30 | $665.77 | 2024-09-06 | $1204.65 |
| Fibonacci Level | Price Level |
|---|---|
| 0.236 | $949.83 |
| 0.382 | $1080.84 |
| 0.5 | $1159.45 |
| 0.618 | $1238.06 |
| 0.786 | $1344.17 |
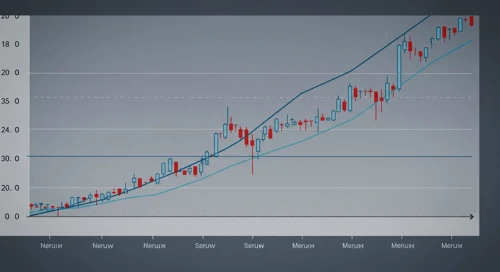
Currently, the stock is trading around the 0.5 retracement level, indicating a potential area of consolidation. If the stock finds support here, it could see further gains towards the 0.618 level.
The 0.5 Fibonacci level may serve as a strong support, suggesting potential bullish momentum if the price maintains above this level.
Conclusion
Netflix's stock has experienced a strong upward trend, reflecting investor confidence in its strategic position and content offerings.
The analysis shows that the stock is consolidating near key Fibonacci levels, which could act as significant support.
However, market participants should remain cautious of potential resistance as competition intensifies in the streaming industry.
Investors looking to enter should await confirmation of support at current Fibonacci levels to mitigate downside risks.
Overall, while short-term fluctuations are expected, Netflix presents long-term growth opportunities supported by its established brand and subscriber base.
Analysts should consider both technical indicators and broader market dynamics when evaluating NFLX's future prospects.
Smart Data Insight
Master the Perfect Entry & Exit for this Stock
Don't leave your profits to chance. Historically, this stock follows specific seasonal patterns that institutional traders use to maximize returns.
- ✅ Identify the "Golden Buying Window"
- ✅ Avoid high-risk correction cycles
- ✅ Backtested data from the last 20+ years