June 30, 2026 a 09:03 am


NEM: Trend and Support & Resistance Analysis - Newmont Corporation
The Newmont Corporation (Ticker: NEM), primarily engaged in the exploration and mining of gold and other precious metals, presents an intriguing investment opportunity. Its global operations, vast reserves, and extensive land portfolio highlight its robust market presence. Recent price movements suggest fluctuations driven by broader economic factors and changes in commodity prices. Investors should focus on technical indicators to better understand the underlying trends and pivotal price points in its trading history.
Trend Analysis
Based on the historical data provided, we computed the Exponential Moving Averages (EMAs) for 20 and 50 days. Observations indicate that the EMA20 fell below the EMA50 in the recent days, confirming a ▼ downward trend. Here is a summary of the trend from the last 7 trading days:
| Date | Close Price | Trend |
|---|---|---|
| 2026-06-29 | 94.51 | ▼ |
| 2026-06-26 | 96.13 | ▼ |
| 2026-06-25 | 95.35 | ▼ |
| 2026-06-24 | 94.04 | ▼ |
| 2026-06-23 | 97.84 | ▼ |
| 2026-06-22 | 101.8 | ▲ |
| 2026-06-18 | 103.79 | ▲ |
The downward trend in recent days suggests potential caution among investors. Technically, this may reveal underlying economic challenges or market adjustments.
Support and Resistance
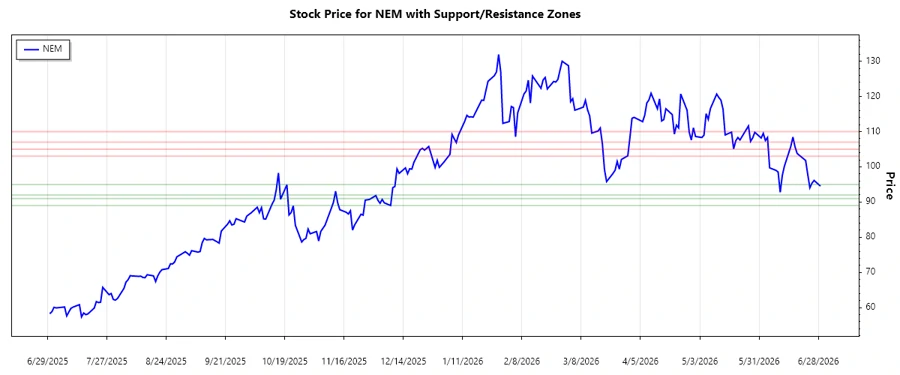
Analysis of recent price data reveals critical support and resistance zones. Calculations from past close prices show potential zones where the price might encounter resistance or support. Here are the identified zones:
| Zone Type | From | To |
|---|---|---|
| Resistance 1 | 107.00 | 110.00 |
| Resistance 2 | 103.00 | 105.00 |
| Support 1 | 92.00 | 95.00 |
| Support 2 | 89.00 | 91.00 |
Currently, the price seems to hover near the first support zone. This may suggest a rebound or further consolidation.
Conclusion
The Newmont Corporation stock shows signs of recent weakness, aligning with broader economic and market pressures. The support and resistance levels identified offer potential areas for buying and selling actions. Investors should watch for price movements around these zones, as they may signify future trajectory shifts. Analyst interpretations of these technical patterns indicate a cautious approach may be beneficial, balancing potential growth against inherent market risks.
Smart Data Insight
Master the Perfect Entry & Exit for this Stock
Don't leave your profits to chance. Historically, this stock follows specific seasonal patterns that institutional traders use to maximize returns.
- ✅ Identify the "Golden Buying Window"
- ✅ Avoid high-risk correction cycles
- ✅ Backtested data from the last 20+ years