September 30, 2025 a 03:15 am
NEM: Trend and Support & Resistance Analysis - Newmont Corporation
Newmont Corporation, a key player in the gold industry, showcases resilience and opportunities within the mining sector. With diverse operations globally, the company stands poised for growth. The recent trend analysis suggests possible market opportunities for investors. Interested investors should consider the technical trends and support/resistance levels presented in this analysis.
Trend Analysis
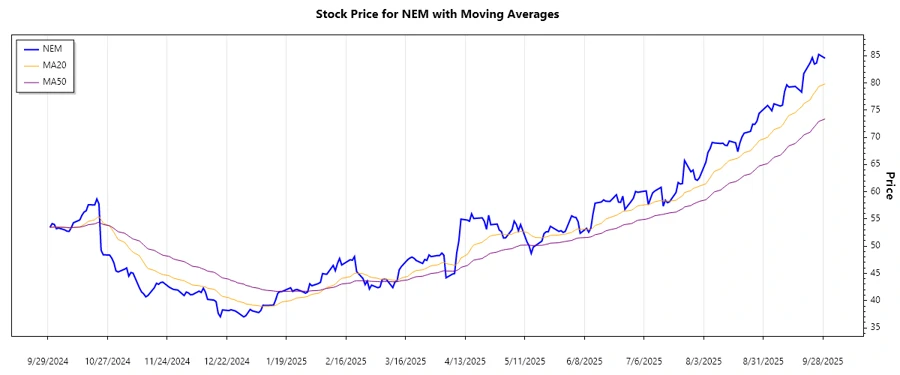
The recent trend of Newmont Corporation (NEM) stock shows a pronounced bullish behavior as the EMA20 has crossed above the EMA50, indicating a potential upward trajectory. Observing daily price movements reveals how robust this trend has been over a short period.
| Date | Closing Price | Trend |
|---|---|---|
| 2025-09-29 | 84.54 | ▲ |
| 2025-09-26 | 85.25 | ▲ |
| 2025-09-25 | 83.67 | ▲ |
| 2025-09-24 | 83.47 | ▲ |
| 2025-09-23 | 84.67 | ▲ |
| 2025-09-22 | 83.72 | ▲ |
| 2025-09-19 | 81.72 | ▲ |
With the EMA20 surpassing the EMA50, the bullish momentum is verified and technical indicators suggest a continuation of this positive trend.
Support and Resistance
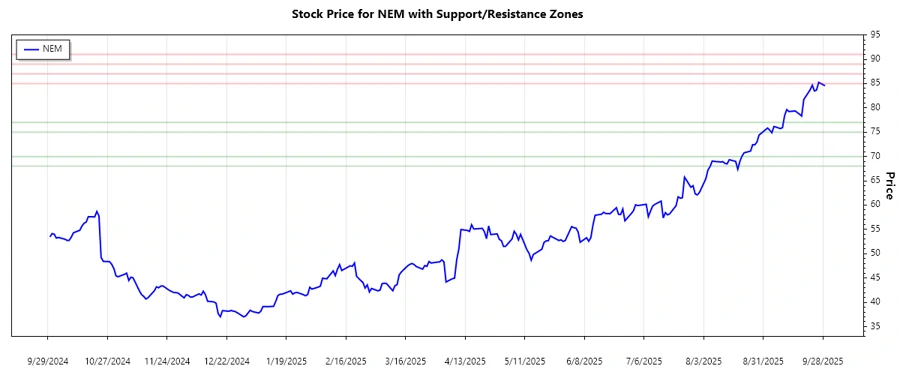
Analysis of support and resistance levels for Newmont Corporation highlights potential zones where price adjustments are expected. These crucial zones can help investors make informed decisions.
| Zone Type | From | To |
|---|---|---|
| Support 1 | 75.00 | 77.00 |
| Support 2 | 68.00 | 70.00 |
| Resistance 1 | 85.00 | 87.00 |
| Resistance 2 | 89.00 | 91.00 |
Currently, the stock price is close to the primary resistance zone, suggesting a possible price reversal if the level holds. Technical patterns necessitate close monitoring.
Conclusion
The Newmont Corporation presents a strong bullish trend backed by favorable technical analysis. The crossing of EMA20 over EMA50 confirms upward momentum, suggesting potential for further gains. However, investors should remain cautious around the identified resistance zones which might halt or reverse the trend. Understanding these dynamics is crucial, though the overall picture for Newmont seems positive with potentials that could be appraised through vigilant technical scrutiny.
Smart Data Insight
Master the Perfect Entry & Exit for this Stock
Don't leave your profits to chance. Historically, this stock follows specific seasonal patterns that institutional traders use to maximize returns.
- ✅ Identify the "Golden Buying Window"
- ✅ Avoid high-risk correction cycles
- ✅ Backtested data from the last 20+ years