August 02, 2025 a 01:15 pm

NEM: Trend and Support & Resistance Analysis - Newmont Corporation
Newmont Corporation, a prominent player in the gold mining industry, has shown notable short-term volatility with underlying trends reflecting broader market conditions. The company's stock has experienced fluctuations influenced by its global operations and commodity price movements. As a key entity in gold production, Newmont continues to attract investor attention, with its stock performance providing insights into market sentiment around precious metals. Understanding technical indicators and support/resistance levels can guide investment strategies.
Trend Analysis
| Date | Closing Price | Trend |
|---|---|---|
| 2025-08-01 | 62.59 | ▲ Uptrend |
| 2025-07-31 | 62.10 | ▲ Uptrend |
| 2025-07-30 | 62.31 | ▲ Uptrend |
| 2025-07-29 | 63.99 | ▲ Uptrend |
| 2025-07-28 | 63.66 | ▲ Uptrend |
| 2025-07-25 | 65.75 | ▲ Uptrend |
| 2025-07-24 | 61.51 | ▼ Downtrend |
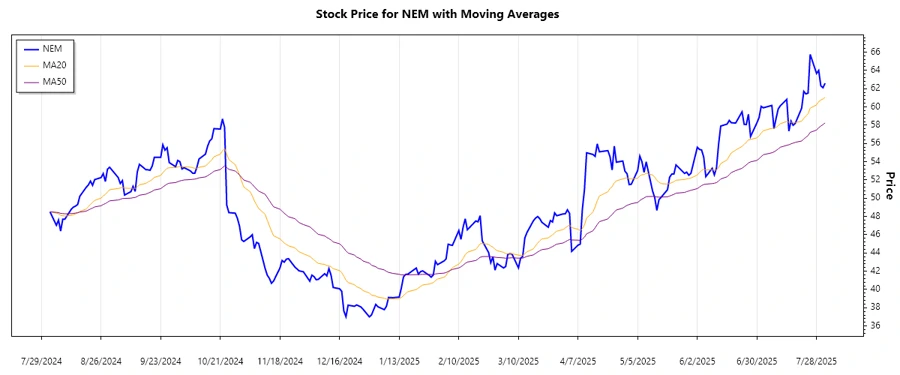
The EMA20 is currently above the EMA50, indicating a dominant upward trend in recent weeks. Investors might consider this a positive sign, potentially signaling further strength ahead.
Support and Resistance
| Zone Type | Level From | Level To |
|---|---|---|
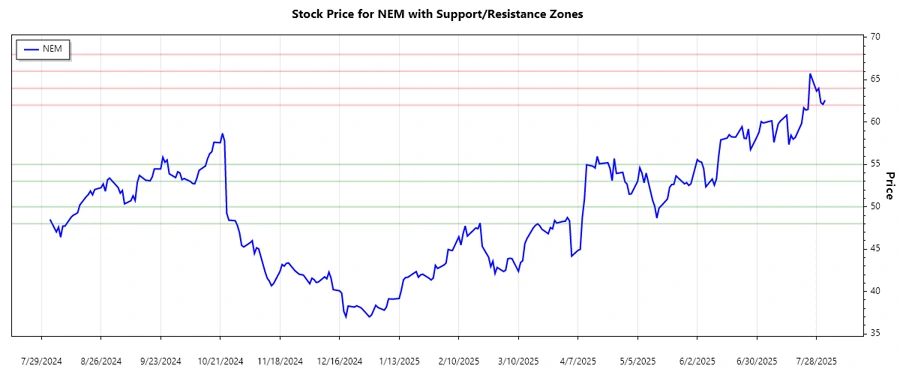
| Support Zone 1 | 53.00 | 55.00 |
| Support Zone 2 | 48.00 | 50.00 |
| Resistance Zone 1 | 62.00 | 64.00 |
| Resistance Zone 2 | 66.00 | 68.00 |
Currently, the stock price is within the first resistance zone, suggesting a critical juncture that could influence near-term movement. Breaking above this range might signal continued bullish momentum.
Conclusion
Newmont Corporation's stock demonstrates a strong ascending trend, propelled by its recent price movements and the state's broader commodity market implications. The current position within a resistance zone opens avenues for either a breakout or pullback, necessitating vigilance. Ensuing price action within these defined technical levels can offer insight into market sentiment and the company’s perceived value. With historical trends showcasing resilience, monitoring unfolding patterns remains essential for opportunistic trading or risk mitigation.
Smart Data Insight
Master the Perfect Entry & Exit for this Stock
Don't leave your profits to chance. Historically, this stock follows specific seasonal patterns that institutional traders use to maximize returns.
- ✅ Identify the "Golden Buying Window"
- ✅ Avoid high-risk correction cycles
- ✅ Backtested data from the last 20+ years