July 19, 2025 a 02:03 pm


NEM: Trend and Support & Resistance Analysis - Newmont Corporation
Newmont Corporation, a leading player in the gold production market, shows significant price movement influenced by global gold demand and economic conditions. Recently, the stock price has exhibited volatility; however, technical indicators reveal an underlying trend. The analysis below provides insight into potential future movements. As of now, Newmont's expansive global operations and extensive reserves bolster its market position amidst cyclical commodity market shifts.
Trend Analysis
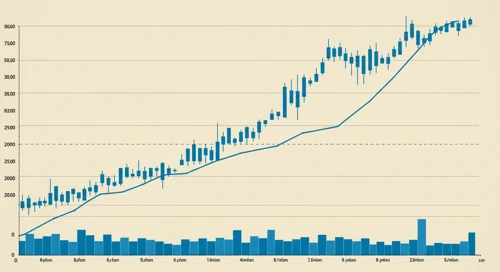
The analysis of Newmont Corporation (NEM) over the last months highlights a dynamic price environment. Using daily closing prices, the EMA20 and EMA50 are computed to assess trending behavior thoroughly.
| Date | Closing Price | Trend |
|---|---|---|
| 2025-07-18 | 58.19 | ⚖️ |
| 2025-07-17 | 57.99 | ⚖️ |
| 2025-07-16 | 58.45 | ⚖️ |
| 2025-07-15 | 57.35 | ⚖️ |
| 2025-07-14 | 60.82 | ▲ |
| 2025-07-11 | 60.13 | ▲ |
| 2025-07-10 | 59.78 | ▲ |
The computed EMA20 currently trends closely with the EMA50, indicating a recent shift towards a neutral, consolidation phase, but with indicators of possible optimism seen in the brief EMA20 divergence upward. However, caution is advised as the price remains in a fluctuating state.
Support- and Resistance
Using historic price levels, two significant support and resistance zones are identified for NEM:
| Zone Type | From | To |
|---|---|---|
| Support Zone 1 | 55.00 | 56.50 |
| Support Zone 2 | 52.50 | 54.00 |
| Resistance Zone 1 | 60.00 | 61.50 |
| Resistance Zone 2 | 62.00 | 63.50 |
The current price is approaching the lower bounds of the predominant resistance zone, suggestive of a retest. Investors should monitor closely for breakouts or reversals within these zones, as they traditionally indicate significant trading behavior or trend changes.
Conclusion
Newmont Corporation's stock performance reveals both challenges and opportunities. The presence of strong support zones fuels optimism, but the looming resistance zones necessitate careful monitoring. Market volatility, driven by gold demand fluctuations and global economic conditions, continues to influence NEM's price movement significantly. Analysts are recommended to focus on key support-resistance interactions and verify breakout authenticity through accompanied volume increases. While a bullish trend appears possible, acknowledged risks include economic downturns or gold price deterioration.
Smart Data Insight
Master the Perfect Entry & Exit for this Stock
Don't leave your profits to chance. Historically, this stock follows specific seasonal patterns that institutional traders use to maximize returns.
- ✅ Identify the "Golden Buying Window"
- ✅ Avoid high-risk correction cycles
- ✅ Backtested data from the last 20+ years