March 01, 2026 a 11:44 am
NEM: Fibonacci Analysis - Newmont Corporation
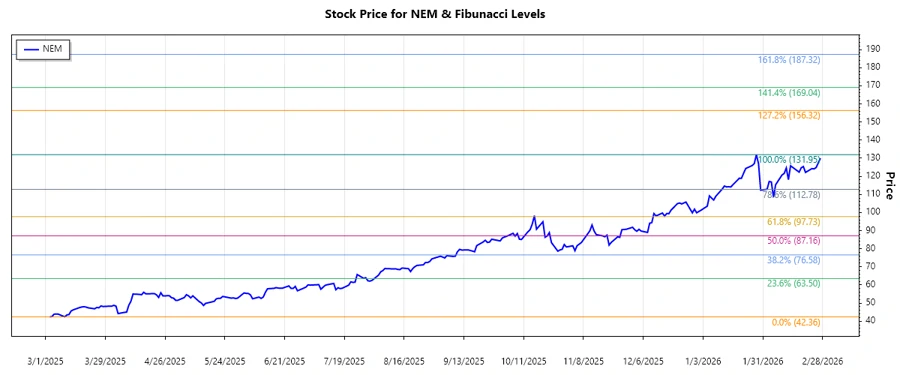
Newmont Corporation has shown a significant uptrend in its stock performance over the given period. With its vast resources and operations in multiple countries, it presents a robust foundation for potential growth. The recent movement indicates favorable conditions, possibly due to changes in commodity prices or strategic corporate decisions.
Fibonacci Analysis
| Detail | Information |
|---|---|
| Trend Start Date | 2025-03-03 |
| Trend End Date | 2026-02-27 |
| Highest Price | $131.95 on 2026-01-28 |
| Lowest Price | $42.36 on 2025-03-03 |
| Fibonacci Level | Price |
|---|---|
| 0.236 | $75.47 |
| 0.382 | $90.58 |
| 0.5 | $103.72 |
| 0.618 | $116.86 |
| 0.786 | $134.66 |
The current stock price at $130 is in the retracement zone of 0.786, suggesting potential resistance here. As it approaches this level, investors should be cautious regarding a possible pullback. However, if the price breaks through convincingly, it may indicate continued upward momentum.
Conclusion
The Newmont Corporation stock has shown a solid upward trend, making it an attractive option for investors in the commodities sector. However, the proximity to resistance at a major Fibonacci level warrants careful observation. The company’s exposures to gold and other metals provide opportunities amid fluctuating market conditions, though macroeconomic factors and commodity prices remain pivotal in determining its trajectory. Analyst consensus may shift if the stock successfully breaches key resistance levels.