July 11, 2025 a 06:44 am

NEM: Fibonacci Analysis - Newmont Corporation
Newmont Corporation (NEM) shows promising potential given its extensive operations in gold production and exploration. With significant proven gold reserves, the company is well-positioned in the market. Recent price movements reveal a notable trend that could provide opportunities for traders focusing on technical indicators like Fibonacci retracement levels for identifying key price levels.
Fibonacci Analysis
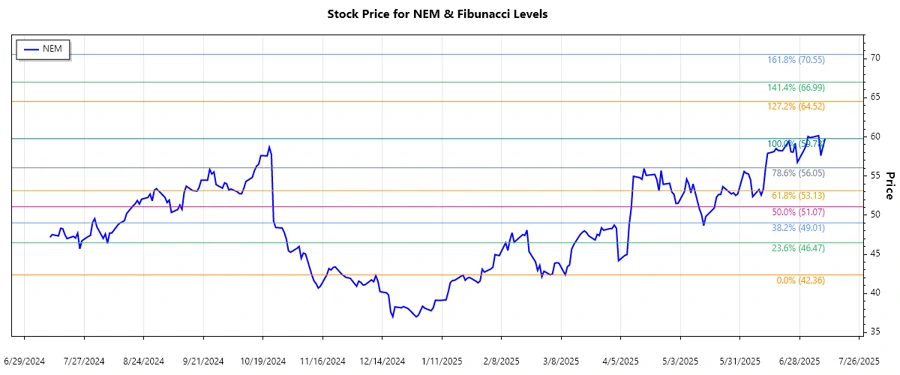
We have identified an upward trend in the stock price data of Newmont Corporation from April 2025 to July 2025. Based on this trend, we've calculated the key Fibonacci retracement levels to help identify potential support and resistance areas.
| Detail | Value |
|---|---|
| Trend Start Date | 2025-03-10 |
| Trend End Date | 2025-07-10 |
| High Price | 59.78 USD (2025-07-10) |
| Low Price | 42.36 USD (2025-03-10) |
| Fibonacci 23.6% | 48.75 USD |
| Fibonacci 38.2% | 51.50 USD |
| Fibonacci 50.0% | 53.07 USD |
| Fibonacci 61.8% | 54.65 USD |
| Fibonacci 78.6% | 56.82 USD |
| Current Price | 59.78 USD |
| Current Retracement Level | None |
| Interpretation | The current price exceeds the retracement levels, potentially indicating an ongoing bullish momentum. |
Conclusion
The analysis of Newmont Corporation's stock indicates a robust upward trend, suggestive of continued bullish sentiment among investors. The company's substantial gold reserves mark it as a key player in the mining sector, which bodes well for long-term growth. However, reliance on commodity prices introduces risk, requiring careful watch over market conditions. Technical analysis with Fibonacci retracement levels suggests potential points for entry and profit-taking, although current levels show price beyond typical retracements, denoting strong market interest.
Smart Data Insight
Master the Perfect Entry & Exit for this Stock
Don't leave your profits to chance. Historically, this stock follows specific seasonal patterns that institutional traders use to maximize returns.
- ✅ Identify the "Golden Buying Window"
- ✅ Avoid high-risk correction cycles
- ✅ Backtested data from the last 20+ years