
June 29, 2026 a 12:46 pm
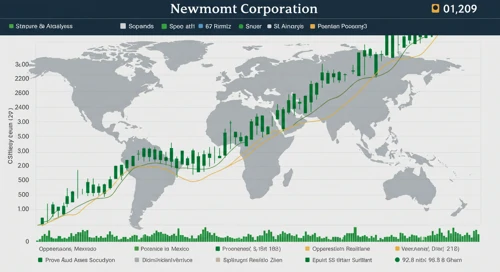


NEM: Dividend Analysis - Newmont Corporation
Newmont Corporation, a leader in mining, boasts a robust dividend history. Despite recent market challenges, the company's strong asset base ensures consistent dividend payments. Their strategic management of resources suggests sustainability in future distributions, appealing to income-focused investors.
📊 Overview
Newmont Corporation is situated in a crucial sector of the economy, delivering essential commodities. With a sector presence that significantly influences global supply chains, its dividend profile is strong but has recently faced some challenges.
| Metric | Value |
|---|---|
| Sector | Materials |
| Dividend yield | 0.95% |
| Current dividend per share | 1 USD |
| Dividend history | 41 years |
| Last cut or suspension | None |
📈 Dividend History
Historically, Newmont's dividend payments reflect its commitment to shareholders through consistent returns. Sustained dividends instill investor confidence, ensuring long-term loyalty.
| Year | Dividend per Share (USD) |
|---|---|
| 2026 | 0.52 |
| 2025 | 1.00 |
| 2024 | 1.00 |
| 2023 | 1.60 |
| 2022 | 2.20 |
⚠️ Dividend Growth
The company's recent growth trends, with a decline noted over both 3 and 5 years, highlight periods of strategic reinvestment or market adaptation tactics. This cautious approach aids in navigating volatile market phases.
| Time | Growth |
|---|---|
| 3 years | -0.23% |
| 5 years | -0.01% |
The average dividend growth is -0.01% over 5 years. This reflects a period of stabilization or market recalibration.
✅ Payout Ratio
Payout ratios serve as critical indicators for dividend sustainability. They reveal the percentage of earnings distributed as dividends, offering insight into the balance between rewarding shareholders and ensuring business growth.
| Key Figure | Ratio (%) |
|---|---|
| EPS-based | 12.83% |
| Free cash flow-based | 8.97% |
The EPS payout ratio of 12.83% indicates conservative dividend distributions, allowing for significant reinvestment potential, while the FCF ratio at 8.97% suggests efficient cash flow management ensuring future dividend commitments.
Cashflow & Capital Efficiency
An analysis of cashflow and capital efficiency indicators unveils the financial resilience and operational effectiveness of Newmont Corporation over recent fiscal years.
| Metric | 2023 | 2024 | 2025 |
|---|---|---|---|
| Free Cash Flow Yield | 0.28% | 6.94% | 6.61% |
| Earnings Yield | -7.24% | 7.85% | 6.42% |
| CAPEX to Operating Cash Flow | 96.49% | 53.47% | 29.37% |
| Stock-based Compensation to Revenue | 0.68% | 0.48% | 0.45% |
| Free Cash Flow / Operating Cash Flow Ratio | 3.51% | 46.53% | 70.63% |
The cashflow yield metrics show improving stability. CAPEX allocation remains within sustainable limits as reinvestments are in alignment with revenue growth.
Balance Sheet & Leverage Analysis
Evaluating key leverage ratios yields insights into how effectively Newmont manages its debt obligations compared to its asset base and equity structure.
| Metric | 2023 | 2024 | 2025 |
|---|---|---|---|
| Debt-to-Equity | 32.51% | 29.98% | 16.87% |
| Debt-to-Assets | 17.00% | 15.92% | 10.00% |
| Debt-to-Capital | 24.53% | 23.06% | 14.43% |
| Net Debt to EBITDA | 3.46 | 0.68 | -0.13 |
| Current Ratio | 1.25 | 1.63 | 2.29 |
| Quick Ratio | 0.81 | 1.34 | 1.82 |
| Financial Leverage | 1.91 | 1.88 | 1.69 |
Newmont's balance sheet improvements indicate strengthened financial health, showcasing reduced leverage and enhanced liquidity.
Fundamental Strength & Profitability
Assessing profitability metrics offers clarity on Newmont's operational efficiency, return potential, and strategic resource allocation over the years.
| Metric | 2023 | 2024 | 2025 |
|---|---|---|---|
| Return on Equity | -8.69% | 11.19% | 20.92% |
| Return on Assets | -4.54% | 5.94% | 12.40% |
| EBIT Margin | -15.14% | 26.74% | 54.60% |
| EBITDA Margin | 15.78% | 42.39% | 67.13% |
| Gross Margin | 9.94% | 34.62% | 49.78% |
| Research & Development to Revenue | 1.70% | 1.06% | 0.75% |
The profitability metrics reflect Newmont's recovery trajectory, highlighting proactive operational strategies that enhance overall market competitiveness.
📉 Price Development
🗣️ Dividend Scoring System
| Criterion | Score | Score Bar |
|---|---|---|
| Dividend Yield | 2 | |
| Dividend Stability | 4 | |
| Dividend Growth | 1 | |
| Payout Ratio | 4 | |
| Financial Stability | 5 | |
| Dividend Continuity | 5 | |
| Cashflow Coverage | 4 | |
| Balance Sheet Quality | 5 |
Overall score: 30/40
🗣️ Rating
Newmont Corporation is rated as a reliable dividend payer with robust financial fundamentals and a longstanding history of dividend payments. Despite recent growth slowdowns, the company’s strong balance sheet and strategic management decisions position it well for future stability and modest yield returns, making it an attractive option for conservative dividend investors.
Smart Data Insight
Master the Perfect Entry & Exit for this Stock
Don't leave your profits to chance. Historically, this stock follows specific seasonal patterns that institutional traders use to maximize returns.
- ✅ Identify the "Golden Buying Window"
- ✅ Avoid high-risk correction cycles
- ✅ Backtested data from the last 20+ years