October 20, 2025 a 07:48 am

NEM: Dividend Analysis - Newmont Corporation
Newmont Corporation (NEM) stands as a prominent player in the mining sector with a robust dividend history extending over 40 years. Despite facing challenges in recent periods, the company maintains its position as a dividend-paying entity. Current market conditions and operational efficiencies will play a significant role in the sustainability of its dividend payouts.
📊 Overview
The overview provides a snapshot of Newmont Corporation's dividend parameters, offering essential insights into its sector affiliation and dividend statistics.
| Metric | Details |
|---|---|
| Sector | Materials |
| Dividend Yield | 1.34% |
| Current Dividend per Share | 0.9991 USD |
| Dividend History | 40 years |
| Last Cut or Suspension | None |
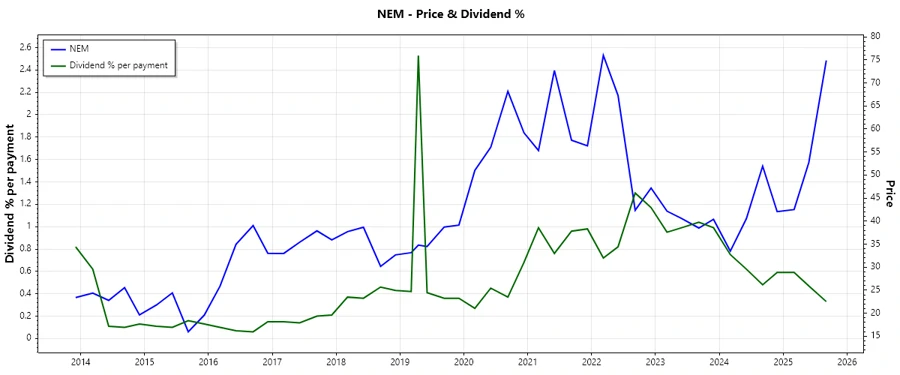
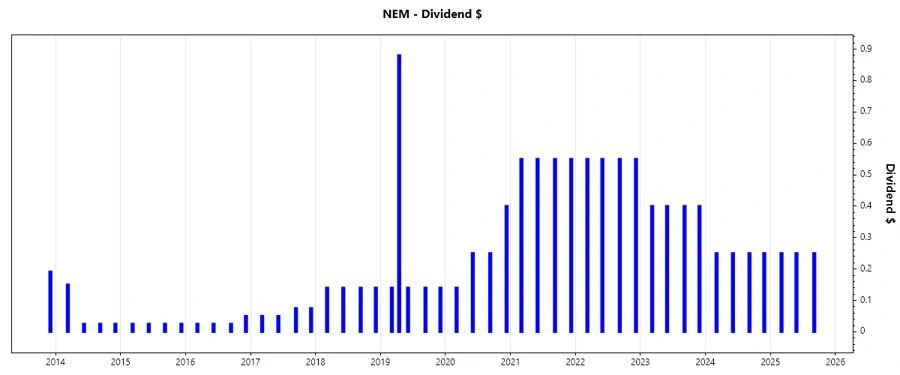
📈 Dividend History
Newmont's dividend history showcases resilience and a commitment to returning value to shareholders. Understanding past payouts helps in gauging future potentials.
The chart above illustrates Newmont's historical dividend payments. Below is the table summarizing the last 5 dividend payments, crucial for understanding recent trends.
| Year | Dividend per Share (USD) |
|---|---|
| 2025 | 0.75 |
| 2024 | 1.00 |
| 2023 | 1.60 |
| 2022 | 2.20 |
| 2021 | 2.20 |
📉 Dividend Growth
Understanding the growth of dividends is pivotal for assessing the company's future payout potential. Growth rates over different periods can signal sustainability and strength.
| Time | Growth |
|---|---|
| 3 years | -0.23% |
| 5 years | -0.07% |
The average dividend growth is -0.07% over 5 years. This shows moderate but steady dividend growth adjustments.
✅ Payout Ratio
Payout ratios offer insight into the proportion of earnings and cash flow used in paying dividends, crucial for dividend sustainability evaluation.
| Key Figure | Ratio |
|---|---|
| EPS-based | 17.67% |
| Free Cash Flow-based | 20.62% |
The low EPS-based payout ratio of 17.67% and FCF-based payout ratio of 20.62% indicate robust coverage, allowing room for operational flexibility.
📈 Cashflow & Capital Efficiency
Cash flow metrics are critical in realizing the sustainability of dividends and understanding how efficient a company is in using its capital.
| Metric | 2024 | 2023 | 2022 |
|---|---|---|---|
| Free Cash Flow Yield | 6.94% | 0.28% | 2.91% |
| Earnings Yield | 7.69% | -7.24% | -1.22% |
| CAPEX to Operating Cash Flow | 53.47% | 96.49% | 66.18% |
| Stock-based Compensation to Revenue | 0.48% | 0.68% | 0.61% |
| Free Cash Flow / Operating Cash Flow Ratio | 46.53% | 3.51% | 33.82% |
The cashflow metrics display significant variances between years, suggesting fluctuations in capital efficiency and revenue stability.
🔍 Balance Sheet & Leverage Analysis
Analyzing leverage and the balance sheet provides a sense of the company's financial stability and capability in managing debt obligations.
| Metric | 2024 | 2023 | 2022 |
|---|---|---|---|
| Debt-to-Equity | 0.30 | 0.33 | 0.32 |
| Debt-to-Assets | 0.16 | 0.17 | 0.16 |
| Debt-to-Capital | 0.23 | 0.25 | 0.24 |
| Net Debt to EBITDA | 0.12 | 3.46 | 0.99 |
| Current Ratio | 1.63 | 1.25 | 2.23 |
| Quick Ratio | 1.34 | 0.81 | 1.63 |
| Financial Leverage | 1.88 | 1.91 | 1.99 |
The moderate debt ratios and leverage metrics signify a cautious approach to managing debt and capital, providing Newmont with financial stability in uncertain times.
💰 Fundamental Strength & Profitability
Profitability measures and fundamental strength guide in evaluating the company's efficiency in generating earnings relative to its expenses and other costs.
| Metric | 2024 | 2023 | 2022 |
|---|---|---|---|
| Return on Equity | 10.96% | -8.69% | -2.37% |
| Return on Assets | 5.82% | -4.54% | -1.19% |
| Net Margin | 17.68% | -21.41% | -3.84% |
| EBIT Margin | 26.74% | -15.14% | 1.47% |
| EBITDA Margin | 42.39% | 15.78% | 27.47% |
| Gross Margin | 34.62% | 9.94% | 17.94% |
| R&D to Revenue | 0.87% | 1.70% | 1.92% |
Profitability indicators reflect operational challenges in recent years, indicating areas for potential improvement and efficiency gains.
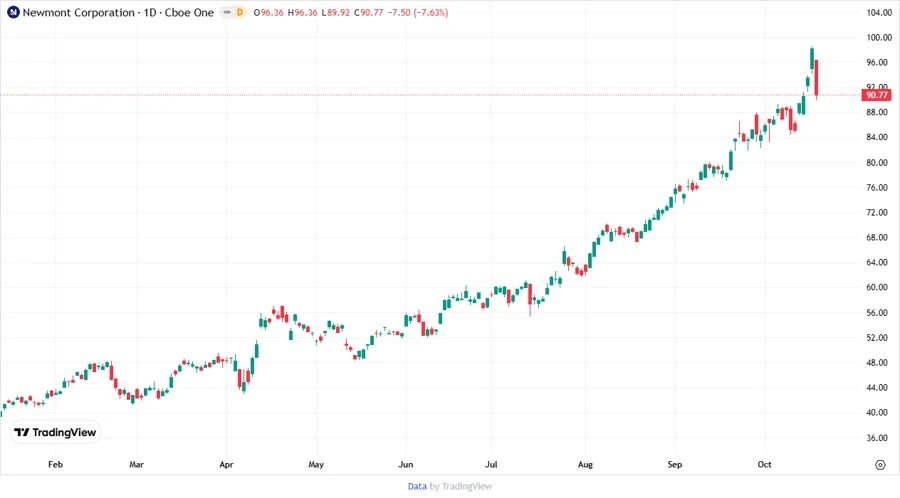
📉 Price Development
🎯 Dividend Scoring System
The dividend scoring system is performed to evaluate various aspects of Newmont's dividend profile through a comprehensive scoring model.
| Category | Score (1-5) | Score Bar |
|---|---|---|
| Dividend Yield | 3 | |
| Dividend Stability | 4 | |
| Dividend Growth | 2 | |
| Payout Ratio | 4 | |
| Financial Stability | 5 | |
| Dividend Continuity | 4 | |
| Cashflow Coverage | 3 | |
| Balance Sheet Quality | 4 |
Total Score: 29/40
🗣️ Rating
Overall, Newmont Corporation exhibits a satisfactory dividend profile with strong financial fundamentals. While recent earnings have been challenged, the company's strong balance sheet and prudent cash flow management lend confidence in its ability to sustain future dividends.
Smart Data Insight
Master the Perfect Entry & Exit for this Stock
Don't leave your profits to chance. Historically, this stock follows specific seasonal patterns that institutional traders use to maximize returns.
- ✅ Identify the "Golden Buying Window"
- ✅ Avoid high-risk correction cycles
- ✅ Backtested data from the last 20+ years