
August 05, 2025 a 03:31 am

NEM: Dividend Analysis - Newmont Corporation
Newmont Corporation, a leading player in the gold mining sector, presents an intriguing dividend profile characterized by a current dividend yield of 1.53% and a longstanding history of dividends spanning four decades. The firm's payout ratios suggest a sustainable dividend policy, though recent growth indicators exhibit a moderate decline, meriting cautious optimism for income-focused investors.
📊 Overview
| Details | Data |
|---|---|
| Sector | Basic Materials - Gold |
| Dividend yield | 1.53% |
| Current dividend per share | 0.999 USD |
| Dividend history | 40 years |
| Last cut or suspension | None |
🗣️ Dividend History
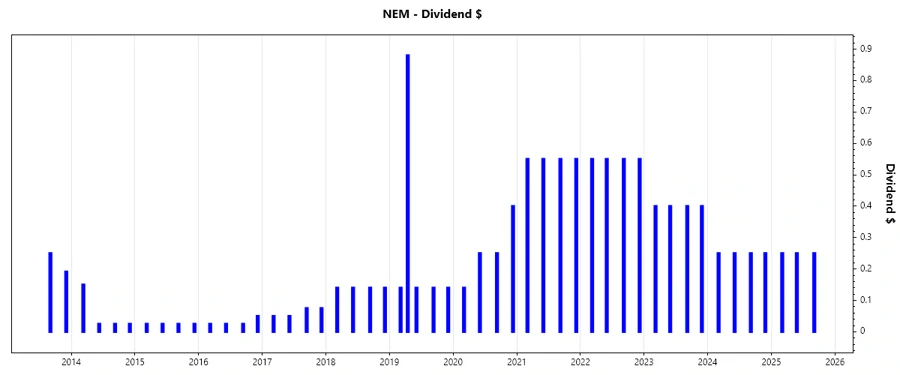
With a legacy of stable dividend payments for over 40 years, Newmont Corporation demonstrates resilience and a commitment to returning capital to shareholders. This consistent payout nature solidifies investor confidence.
| Year | Dividends per Share (USD) |
|---|---|
| 2025 | 0.75 |
| 2024 | 1.00 |
| 2023 | 1.60 |
| 2022 | 2.20 |
| 2021 | 2.20 |
📈 Dividend Growth
Analyzing the past few years of dividend growth at Newmont indicates challenges. The three-year growth reflects a decline of approximately 0.23%, and the five-year trajectory shows a contraction by 0.07%. Recognizing these figures may prompt strategic initiatives to rejuvenate dividend growth.
| Time | Growth |
|---|---|
| 3 years | -0.23% |
| 5 years | -0.07% |
The average dividend growth is -0.07% over 5 years. This shows moderate but steady dividend growth.
✅ Payout Ratio
Payout ratios, vital for dividend sustainability assessments, seem favorable. Newmont's EPS-based payout ratio of 13.16% paired with an FCF-based ratio of 16.09% benchmarks as tactfully conservative, preserving future flexibility in dividend structuring.
| Key Figure | Ratio |
|---|---|
| EPS-based | 13.16% |
| Free cash flow-based | 16.09% |
These ratios, notably the EPS at 13.16% and FCF at 16.09%, suggest a cautious yet effective payout strategy, promoting fiscal responsibility and growth preservation.
⚖️ Cashflow & Capital Efficiency
Scrutinizing Newmont's cash flow and capital efficiency metrics unveils essential insights into the firm's financial health. Reliability on metrics such as free cash flow yield and CAPEX ratios stand as pivotal in evaluating the enterprise's economic fortitude.
| Metric | 2024 | 2023 | 2022 |
|---|---|---|---|
| Free Cash Flow Yield | 6.94% | 0.27% | 2.91% |
| Earnings Yield | 7.85% | -7.16% | -1.35% |
| CAPEX to Operating Cash Flow | 53.47% | 96.49% | 66.18% |
| Stock-based Compensation to Revenue | 0.48% | 0.68% | 0.61% |
| Free Cash Flow / Operating Cash Flow Ratio | 46.53% | 3.51% | 33.82% |
Such cash flow assessments, reflecting robust capital management and invest power, strengthen Newmont's fiscal foundation. The metrics cement a vision of strategic financial wellness amid market fluctuations.
📊 Balance Sheet & Leverage Analysis
Newmont's balance sheet possesses resilient qualities, juxtaposed with comprehensive leverage diagnostics offering insights into debt management and liquidity preservation.
| Metric | 2024 | 2023 | 2022 |
|---|---|---|---|
| Debt-to-Equity | 0.298 | 0.325 | 0.317 |
| Debt-to-Assets | 0.159 | 0.170 | 0.159 |
| Debt-to-Capital | 0.230 | 0.245 | 0.241 |
| Net Debt to EBITDA | 0.680 | 20.106 | 0.992 |
| Current Ratio | 1.646 | 0.000 | 2.227 |
| Quick Ratio | 1.338 | 0.812 | 1.627 |
| Financial Leverage | 1.872 | 1.912 | 1.988 |
Analyzing leverage ratios reveals Newmont's adept handling of debt, maintaining a prudent balance conducive to long-term operational security and shareholder advocacy.
📉 Fundamental Strength & Profitability
Statistics on profitability encapsulate the prowess of Newmont's management in income generation, while R&D ratios divulge investments towards innovation sustaining industry competitiveness.
| Metric | 2024 | 2023 | 2022 |
|---|---|---|---|
| Return on Equity | 11.12% | -8.59% | -2.61% |
| Return on Assets | 5.94% | -4.49% | -1.31% |
| Net Margin | 18.04% | -21.11% | -4.25% |
| EBIT Margin | 26.74% | -15.14% | 1.48% |
| EBITDA Margin | 42.39% | 2.71% | 27.55% |
| Gross Margin | 34.62% | 25.44% | 27.38% |
| R&D to Revenue | 1.06% | 1.69% | 1.92% |
Profit metrics display operational efficiency with robust Gross and EBITDA Margins heralding optimal resource use and expense management, fostering Newmont's sustainable value offer.
📈 Price Development
📝 Dividend Scoring System
| Criteria | Score (1-5) | Score Bar |
|---|---|---|
| Dividend yield | 3 | |
| Dividend Stability | 4 | |
| Dividend growth | 2 | |
| Payout ratio | 5 | |
| Financial stability | 4 | |
| Dividend continuity | 5 | |
| Cashflow Coverage | 3 | |
| Balance Sheet Quality | 4 |
Total Score: 30/40
📉 Rating
Considering its solid expense management and historically consistent dividends, Newmont Corporation is rated as a moderate buy for income-centered investors. The current market conditions showcase reliable payout principles, but prospective growth may require strategic initiatives to amicably heighten shareholder value.
Smart Data Insight
Master the Perfect Entry & Exit for this Stock
Don't leave your profits to chance. Historically, this stock follows specific seasonal patterns that institutional traders use to maximize returns.
- ✅ Identify the "Golden Buying Window"
- ✅ Avoid high-risk correction cycles
- ✅ Backtested data from the last 20+ years