March 18, 2026 a 03:43 pm
NEE: Fundamental Ratio Analysis - NextEra Energy, Inc.
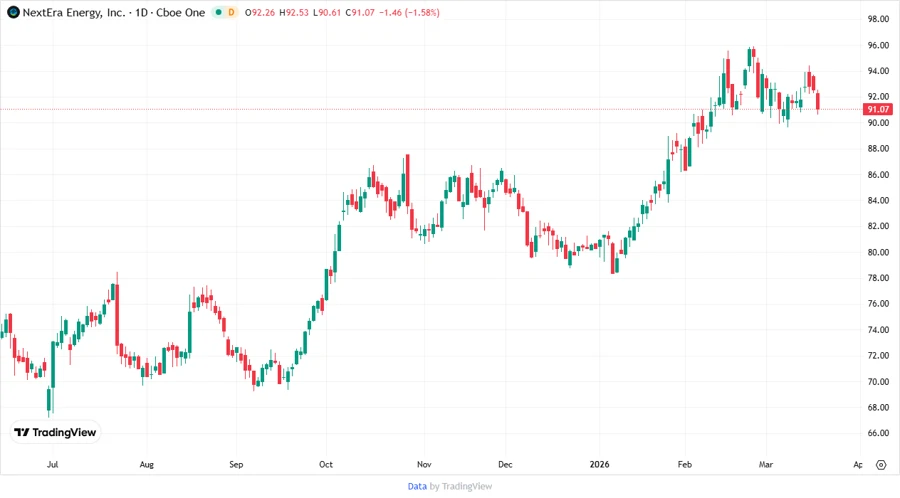
NextEra Energy, Inc. is a leading clean energy company that generates electricity through a diverse portfolio of assets including wind, solar, and nuclear facilities. The stock has exhibited steady performance with a focus on sustainable energy solutions. However, evolving regulatory environments and market dynamics could present challenges.
Fundamental Rating
The fundamental analysis indicates a stable performance with some room for improvement, especially in debt management and valuation metrics.
| Category | Score | Visualization |
|---|---|---|
| Discounted Cash Flow | 4/5 | |
| Return on Equity | 4/5 | |
| Return on Assets | 4/5 | |
| Debt to Equity | 2/5 | |
| Price to Earnings | 2/5 | |
| Price to Book | 1/5 |
Historical Rating
The historical data highlights a consistent performance across core financial metrics, maintaining a positive outlook.
| Date | Overall | DCF | ROE | ROA | Debt/Equity | P/E | P/B |
|---|---|---|---|---|---|---|---|
| 2026-03-18 | 3 | 4 | 4 | 4 | 2 | 2 | 1 |
| Previous | 0 | 4 | 4 | 4 | 2 | 2 | 1 |
Analyst Price Targets
Analysts have set optimistic price targets, with a consensus indicating moderate upside potential.
| High | Low | Median | Consensus |
|---|---|---|---|
| $106 | $84 | $92 | $93.27 |
Analyst Sentiments
The sentiment remains favorable with a predominant inclination towards buying, but with some cautionary hold recommendations.
| Recommendation | Count | Visualization |
|---|---|---|
| Strong Buy | 0 | |
| Buy | 23 | |
| Hold | 12 | |
| Sell | 1 | |
| Strong Sell | 0 |
Conclusion
NextEra Energy, Inc. continues to leverage its robust and diversified energy portfolio, maintaining a solid foundational performance with a strong buy recommendation from analysts. The potential for growth in clean energy sectors reflects significant opportunities. However, challenges such as the debt-to-equity ratio and broader economic factors could affect future performance. Overall, the stock remains a promising option for sustainable investment focus.
Smart Data Insight
Master the Perfect Entry & Exit for this Stock
Don't leave your profits to chance. Historically, this stock follows specific seasonal patterns that institutional traders use to maximize returns.
- ✅ Identify the "Golden Buying Window"
- ✅ Avoid high-risk correction cycles
- ✅ Backtested data from the last 20+ years