
May 27, 2026 a 03:15 pm
NEE: Fibonacci Analysis - NextEra Energy, Inc.
NextEra Energy, Inc. is a leading clean energy company championing renewable energy projects across North America. Their commitment to sustainable energy solutions has positioned them as a market leader, impacting millions of customers. However, recent market data indicates significant fluctuations, prompting a technical analysis to better understand potential resistance and support levels.
Fibonacci Analysis
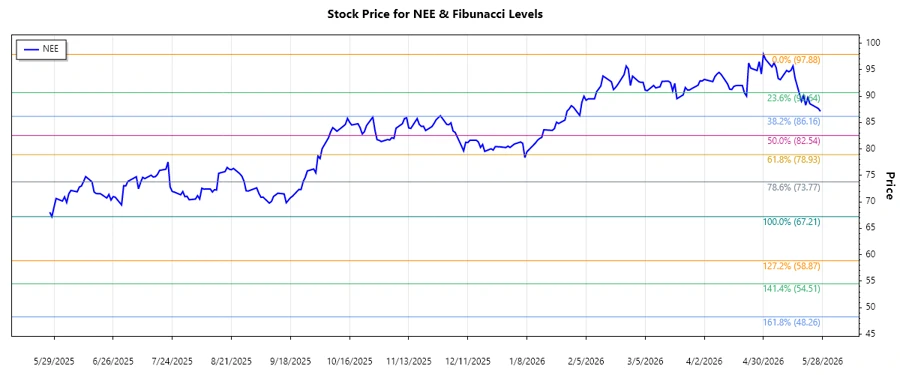
The analysis is based on the historical stock prices of NEE. The dataset indicates a dominant downtrend in recent months. This analysis involves identifying key Fibonacci retracement levels to anticipate possible resistance or support zones.
| Detail | Value |
|---|---|
| Trend Start Date | 2025-05-27 |
| Trend End Date | 2026-05-27 |
| High Price and Date | $97.88 on 2026-04-30 |
| Low Price and Date | $67.21 on 2025-05-28 |
| Fibonacci Level | Price |
|---|---|
| 0.236 | $76.61 |
| 0.382 | $81.82 |
| 0.5 | $85.37 |
| 0.618 | $88.92 |
| 0.786 | $93.14 |
As of the latest data, the current price is trading around $87.115, falling within the 0.5 retracement level. This suggests potential moderate support at this Fibonacci level. If the price consolidates here, it may indicate a stabilization phase or possible reversal, contingent upon market conditions.
Conclusion
NextEra Energy's stock appears poised at a critical juncture, with a technical foundation highlighting a potential stabilization. The proximity to the 0.5 Fibonacci retracement level could suggest moderate support, offering potential opportunity zones for investors. However, risks remain due to market volatility and broader economic factors. Analysts should watch for breakouts above the 0.618 level to affirm bullish strength or remain cautious should it fall towards the 0.236 zone, which may signal further bearish sentiment.
Smart Data Insight
Master the Perfect Entry & Exit for this Stock
Don't leave your profits to chance. Historically, this stock follows specific seasonal patterns that institutional traders use to maximize returns.
- ✅ Identify the "Golden Buying Window"
- ✅ Avoid high-risk correction cycles
- ✅ Backtested data from the last 20+ years