February 01, 2026 a 06:44 am

NEE: Fibonacci Analysis - NextEra Energy, Inc.
NextEra Energy, Inc. is a leader in renewable energy generation, leveraging a robust mix of wind, solar, and nuclear facilities to drive growth. The stock has shown significant resilience within the energy sector, often appealing to investors seeking both stability and innovation. Recent movements indicate a retracement phase, presenting potential entry points for market participants.
Fibonacci Analysis
| Metric | Details |
|---|---|
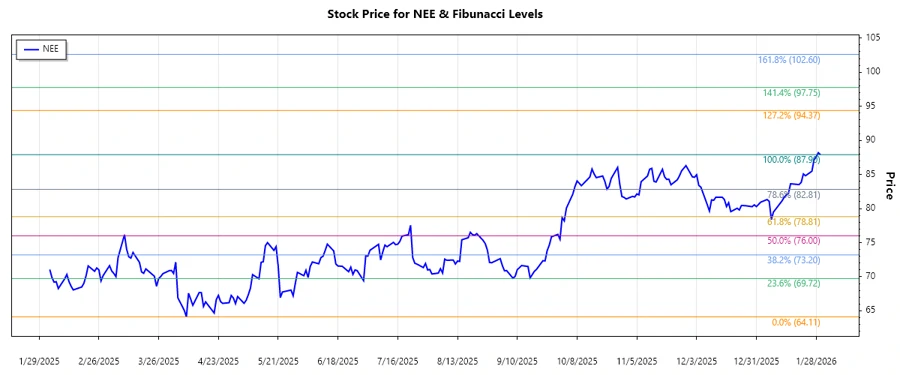
| Trend Start Date | 2025-04-03 |
| Trend End Date | 2026-01-30 |
| High Point | $87.9 on 2026-01-30 |
| Low Point | $64.11 on 2025-04-08 |
| Fibonacci Levels |
|
| Current Price in Retracement Zone | 0.236 |
| Technical Interpretation | The current price confirms presence in the 0.236 retracement zone, which could act as temporary support, signaling potential for a bounce back towards higher levels if buying pressure sustains. |
Conclusion
NextEra Energy, Inc.'s stock has witnessed an uptrend from April 2025 to January 2026, showcasing strong price appreciation. Despite a minor correction, the current Fibonacci retracement level provides strategic entry opportunities for investors. The company's leading position in renewable energy sector remains its core strength, though regulatory challenges and market volatility could impact future growth. Technicals indicate robust support, but caution is advised due to potential resistance at higher retracement levels. A sustained influx of volume could enhance the bullish outlook. In summary, while NextEra Energy holds promise for continued advance, vigilant monitoring of market trends and economic indicators is paramount for informed decisions.