May 20, 2026 a 12:46 pm

NEE: Dividend Analysis - NextEra Energy, Inc.
NextEra Energy, Inc. is a leading company recognized for its robust dividend profile. Offering a dividend yield of 2.48%, it maintains a long history of consistent dividend payouts over 45 years. Although the current dividend yield is moderate, its growth is steady, supported by a strategic approach to financial management and capital efficiency.
📊 Overview
NextEra Energy operates within the utility sector, which is known for its stability and attractiveness to dividend-seeking investors. The company’s dividend yield currently stands at 2.48%, with a current dividend per share of 2.24 USD, reflecting its solid commitment to shareholders. The dividend history of 45 years underscores the company's reliability in dividend continuity, with no recent cuts or suspensions.
| Detail | Statistic |
|---|---|
| Sector | Utilities |
| Dividend Yield | 2.48% |
| Current Dividend Per Share | 2.24 USD |
| Dividend History | 45 years |
| Last Cut or Suspension | None |
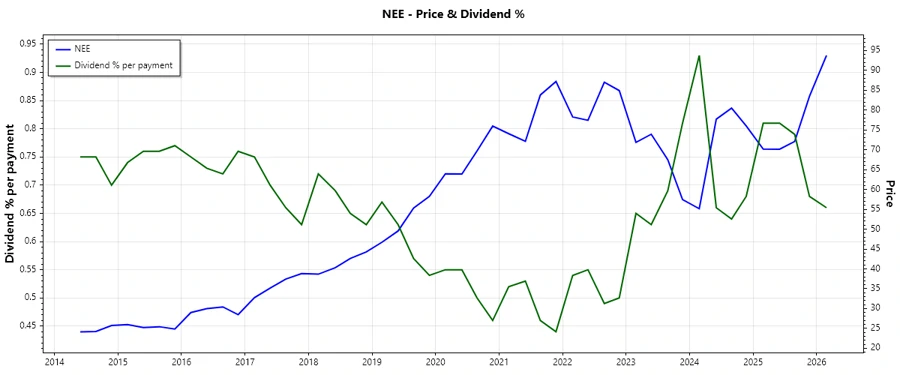
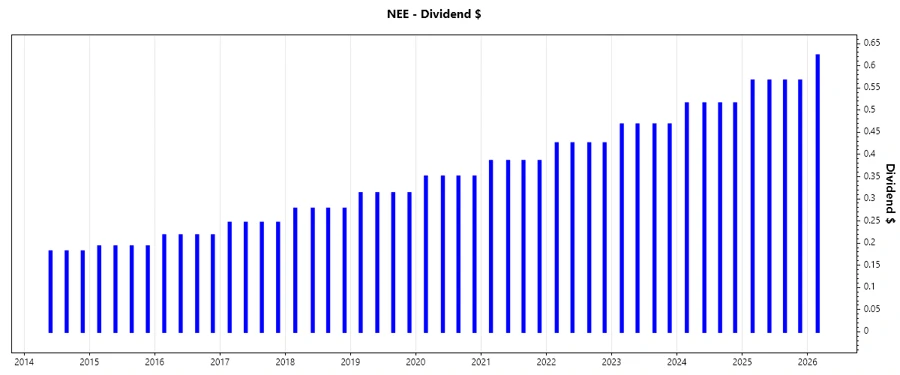
🗣️ Dividend History
The dividend history is pivotal in assessing a firm's commitment to returning capital to shareholders. NextEra Energy has shown remarkable consistency in its dividend payments over the decades, thereby attracting investors looking for stable returns.
| Year | Dividend Per Share (USD) |
|---|---|
| 2026 | 0.6232 |
| 2025 | 2.2660 |
| 2024 | 2.0600 |
| 2023 | 1.8700 |
| 2022 | 1.7000 |
📈 Dividend Growth
Understanding the growth trajectory of dividends is crucial for evaluating the future potential of income streams. Over the past 3 and 5 years, NextEra Energy has illustrated a stable growth path, reinforcing its position as a reliable dividend generator.
| Time | Growth |
|---|---|
| 3 years | 10.05% |
| 5 years | 10.11% |
The average dividend growth is 10.11% over 5 years. This shows moderate but steady dividend growth.
📉 Payout Ratio
Payout ratios are crucial for evaluating whether a company can sustain its dividend payments from its earnings and cash flow perspectives. For NextEra Energy, the EPS-based payout ratio is 57.19%, and the Free Cash Flow-based payout ratio stands significantly higher at 197.71%.
| Key Figure | Ratio |
|---|---|
| EPS-based | 57.19% |
| Free Cash Flow-based | 197.71% |
While the EPS-based ratio suggests dividends are currently sustainable, the high FCF-based ratio indicates potential stress in covering dividends from free cash flow alone, highlighting the importance of operational efficiency.
✅ Cashflow & Capital Efficiency
Evaluating the cash flow dynamics and capital efficiency is essential to understanding the company's financial stability and its ability to fund dividends from generated cash flows.
| Metric | 2023 | 2024 | 2025 |
|---|---|---|---|
| Free Cash Flow Yield | 1.42% | 3.22% | 1.91% |
| Earnings Yield | 5.94% | 4.71% | 4.08% |
| CAPEX to Operating Cash Flow | 84.49% | 64.21% | 74.28% |
| Stock-based Compensation to Revenue | 0 | 0 | 0 |
| Free Cash Flow / Operating Cash Flow Ratio | 15.51% | 35.79% | 25.72% |
The metrics highlight the company's operational efficiency and ability to generate cash flow, underscoring its potential to meet dividend obligations. A higher earnings yield supports financial flexibility for growth and dividends.
⚠️ Balance Sheet & Leverage Analysis
Analyzing leverage and liquidity ratios helps assess the company’s financial resilience and capacity to manage its debts sustainably while continuing with dividend payouts.
| Metric | 2023 | 2024 | 2025 |
|---|---|---|---|
| Debt-to-Equity | 1.54 | 1.64 | 1.75 |
| Debt-to-Assets | 41.25% | 43.30% | 44.95% |
| Debt-to-Capital | 60.67% | 62.17% | 63.65% |
| Net Debt to EBITDA | 4.21 | 5.76 | 5.74 |
| Current Ratio | 0.55 | 0.47 | 0.60 |
| Quick Ratio | 0.47 | 0.38 | 0.49 |
| Financial Leverage | 3.74 | 3.80 | 3.90 |
Despite a leveraged financial structure, the company's current and quick ratios suggest adequate liquidity. The debt ratios reflect a cautious approach to leveraging assets to enhance shareholder returns.
🗣️ Fundamental Strength & Profitability
Key profitability metrics like Return on Equity (ROE) and margins offer insight into the company's operational effectiveness and its ability to generate returns from equity financing.
| Metric | 2023 | 2024 | 2025 |
|---|---|---|---|
| Return on Equity | 15.40% | 13.86% | 12.51% |
| Return on Assets | 4.12% | 3.65% | 3.21% |
| Net Profit Margin | 26.00% | 28.06% | 24.87% |
| Gross Profit Margin | 63.94% | 60.06% | 62.80% |
| EBIT Margin | 37.75% | 33.42% | 33.13% |
| EBITDA Margin | 59.63% | 56.69% | 58.83% |
| R&D to Revenue | 0 | 0 | 0 |
These metrics indicate a robust ability to generate profits with high efficiency, although financial leverage remains high. The absence of R&D expense suggests a focus on optimizing existing assets and operations primarily.
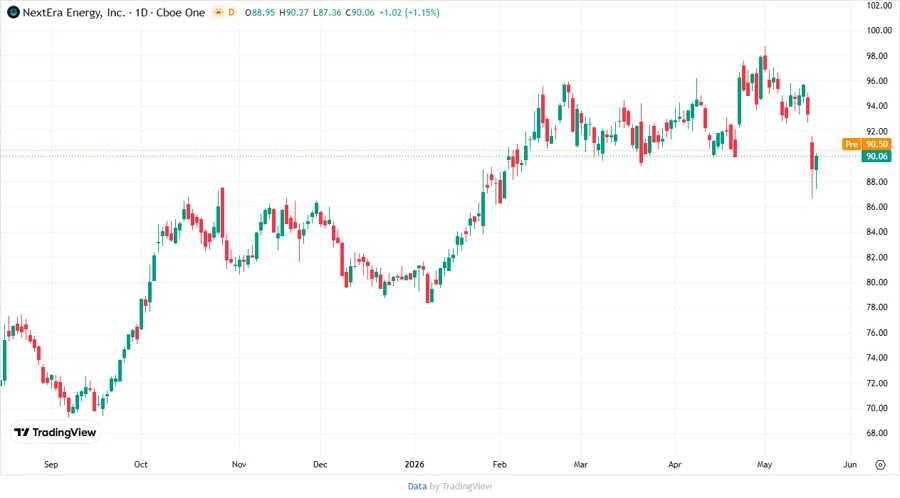
📈 Price Development
🗣️ Dividend Scoring System
The following scoring evaluates various aspects of NextEra Energy's dividend metrics, reflecting their overall strength and potential for investors:
| Category | Score | Bar |
|---|---|---|
| Dividend Yield | 3 | |
| Dividend Stability | 5 | |
| Dividend Growth | 4 | |
| Payout Ratio | 3 | |
| Financial Stability | 4 | |
| Dividend Continuity | 5 | |
| Cashflow Coverage | 3 | |
| Balance Sheet Quality | 3 |
Total Score: 30/40
✅ Rating
NextEra Energy presents a sound investment prospect for dividend-seeking investors due to its stable dividend payments, consistent dividend growth, formidable financial management, and strategic capital efficiency. We recommend a "Buy" position for investors aligned with a stable yet growth-oriented dividend profile.
Smart Data Insight
Master the Perfect Entry & Exit for this Stock
Don't leave your profits to chance. Historically, this stock follows specific seasonal patterns that institutional traders use to maximize returns.
- ✅ Identify the "Golden Buying Window"
- ✅ Avoid high-risk correction cycles
- ✅ Backtested data from the last 20+ years