April 30, 2026 a 07:46 am


NEE: Dividend Analysis - NextEra Energy, Inc.
NextEra Energy, Inc. has exhibited a commendable dividend profile with a notable history of consistent payouts over 45 consecutive years. As an energy sector giant, the company's strategic focus on sustainable and steady dividend growth makes it a compelling choice for dividend-seeking investors. However, with a high free cash flow payout ratio, caution is advised.
📊 Overview
NextEra Energy, Inc., a prominent leader in the electrical utilities sector, currently offers a dividend yield of 2.48%. With a stable history of 45 years without any recent cuts or suspensions, it reflects reliability in dividend payments.
| Metric | Detail |
|---|---|
| Sector | Electrical Utilities |
| Dividend Yield | 2.48% |
| Current Dividend per Share | 2.24 USD |
| Dividend History | 45 years |
| Last Cut or Suspension | None |
🗣️ Dividend History
The importance of analyzing a company's dividend history lies in understanding its stability and commitment to returns. NextEra Energy, Inc. has consistently increased dividends, signaling strong financial health and shareholder value creation.
| Year | Dividend per Share (USD) |
|---|---|
| 2026 | 0.6232 |
| 2025 | 2.2660 |
| 2024 | 2.0600 |
| 2023 | 1.8700 |
| 2022 | 1.7000 |
📈 Dividend Growth
Dividend growth is crucial as it reflects the company's capability to enhance shareholder returns over time. With a 5-year growth of 10.11%, NextEra Energy offers moderate but steady dividend growth, enhancing investor confidence.
| Time | Growth |
|---|---|
| 3 years | 10.05% |
| 5 years | 10.11% |
The average dividend growth is 10.11% over 5 years. This shows moderate but steady dividend growth.
📉 Payout Ratio
The payout ratio is a key indicator of the sustainability of a company's dividend payment. While an EPS payout ratio of 57.19% is within a healthy range, the free cash flow payout ratio at 197.71% suggests careful monitoring of cash flow sustainability.
| Key figure | Ratio |
|---|---|
| EPS-based | 57.19% |
| Free cash flow-based | 197.71% |
The payout ratio suggests that while earnings support the dividend, the dependence on cash flow highlights some potential risk areas.
Cashflow & Capital Efficiency
It's essential to ensure a company can effectively generate cash flow to sustain operations and capital expenses. This includes understanding the relationship between CAPEX, cash flows, and stock-based compensation.
| Year | Free Cash Flow Yield | Earnings Yield | CAPEX to Operating Cash Flow | Stock-based Compensation to Revenue | Free Cash Flow / Operating Cash Flow Ratio |
|---|---|---|---|---|---|
| 2025 | 0.0191 | 0.0407 | 0.7428 | 0 | 0.2572 |
| 2024 | 0.0322 | 0.0471 | 0.6421 | 0 | 0.3579 |
| 2023 | 0.0142 | 0.0594 | 0.8449 | 0 | 0.1551 |
Cash flow and capital efficiency ratios indicate that while NextEra Energy has robust capital efficiency, the company must address the correlation between operating cash flow and capex to sustain long-term growth.
Balance Sheet & Leverage Analysis
Analyzing leverage provides insight into the long-term financial stability and risk profile of the company, vital for dividend sustainability.
| Year | Debt-to-Equity | Debt-to-Assets | Debt-to-Capital | Net Debt to EBITDA | Current Ratio | Quick Ratio | Financial Leverage |
|---|---|---|---|---|---|---|---|
| 2025 | 1.7510 | 0.4495 | 0.6365 | 5.7412 | 0.5953 | 0.4893 | 3.8954 |
| 2024 | 1.6433 | 0.4330 | 0.6217 | 5.7611 | 0.4713 | 0.3840 | 3.7952 |
| 2023 | 1.5423 | 0.4125 | 0.6067 | 4.2069 | 0.5493 | 0.4740 | 3.7391 |
NextEra Energy's leverage profile shows increasing debt, indicating a higher risk profile. Improvements in current and quick ratios would enhance liquidity.
Fundamental Strength & Profitability
Assessing profitability through various return metrics ensures the company's ability to generate sufficient returns on assets and equity critical for sustainable dividends.
| Year | Return on Equity | Return on Assets | Net Margin | EBIT Margin | EBITDA Margin | Gross Margin | R&D to Revenue |
|---|---|---|---|---|---|---|---|
| 2025 | 0.1251 | 0.0321 | 0.2487 | 0.3313 | 0.5883 | 0.6280 | 0 |
| 2024 | 0.1386 | 0.0365 | 0.2806 | 0.3342 | 0.5669 | 0.6006 | 0 |
| 2023 | 0.1540 | 0.0412 | 0.2600 | 0.3775 | 0.5963 | 0.6394 | 0 |
With steady returns on equity and assets, combined with solid profit margins, NextEra Energy, Inc. demonstrates robust profitability critical for sustaining dividends.
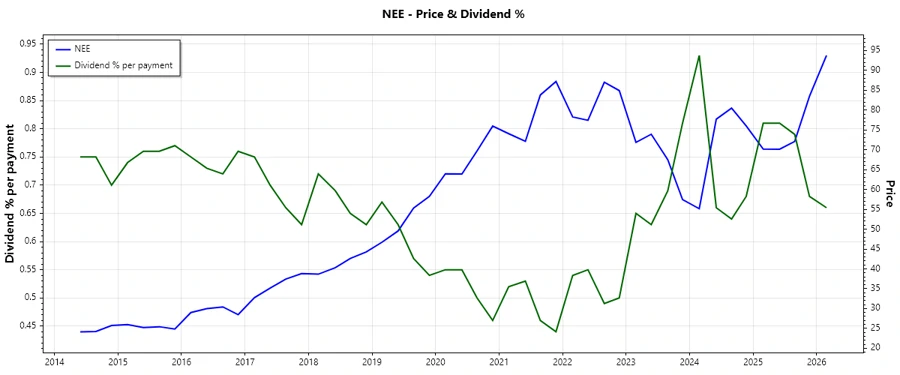
Price Development
✅ Dividend Scoring System
| Category | Score | Evaluation |
|---|---|---|
| Dividend Yield | 4 | |
| Dividend Stability | 5 | |
| Dividend Growth | 4 | |
| Payout Ratio | 3 | |
| Financial Stability | 3 | |
| Dividend Continuity | 5 | |
| Cashflow Coverage | 3 | |
| Balance Sheet Quality | 3 |
Total Score: 30/40
Rating
NextEra Energy, Inc. is a solid choice for dividend investors seeking stability and modest growth. While the company's high free cash flow payout ratio suggests some liquidity management challenges, its robust historical dividend growth and market presence deliver a compelling investment opportunity. Overall, a reliable addition to a diversified income-focused portfolio.