October 19, 2025 a 07:31 am
NEE: Dividend Analysis - NextEra Energy, Inc.
NextEra Energy, Inc. is a prominent player in the energy sector, known for its robust dividend history and steady growth. Recent analysis highlights its strong market presence and commitment to providing shareholder value through dividends. With a market cap of $174 billion, its financial metrics and historical performance indicate a stable investment option with consistent income potential.
Overview 📊
NextEra Energy, Inc. stands as a leader in the Utilities sector. Its dividend yield currently sits at 3.07%, providing investors with a reliable income stream. With a current dividend per share of $2.06 and an impressive dividend history spanning 44 years, the company has shown resilience in maintaining shareholder returns. The absence of any recent cuts or suspensions further underlines its commitment to dividend stability.
| Metric | Details |
|---|---|
| Sector | Utilities |
| Dividend Yield | 3.07 % |
| Current Dividend Per Share | $2.06 |
| Dividend History | 44 Years |
| Last Cut or Suspension | None |
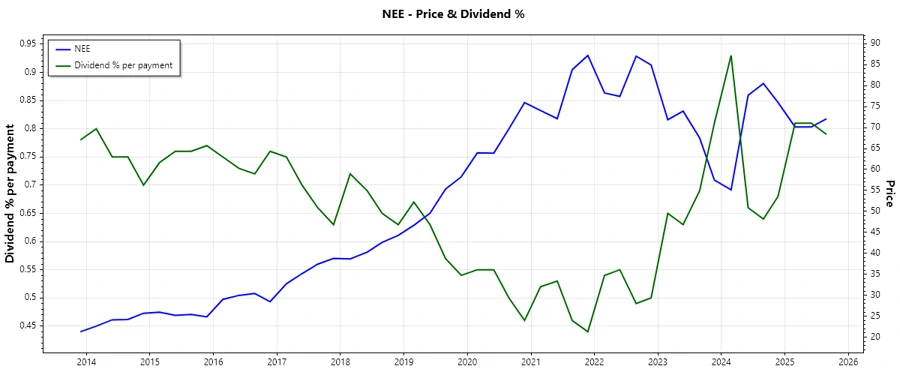
Dividend History 🗣️
The historical dividend record of NextEra Energy is a testament to its financial strength and commitment to shareholders. It's crucial in assessing the stability and predictability of future dividend payments. A strong dividend history enhances investor confidence.
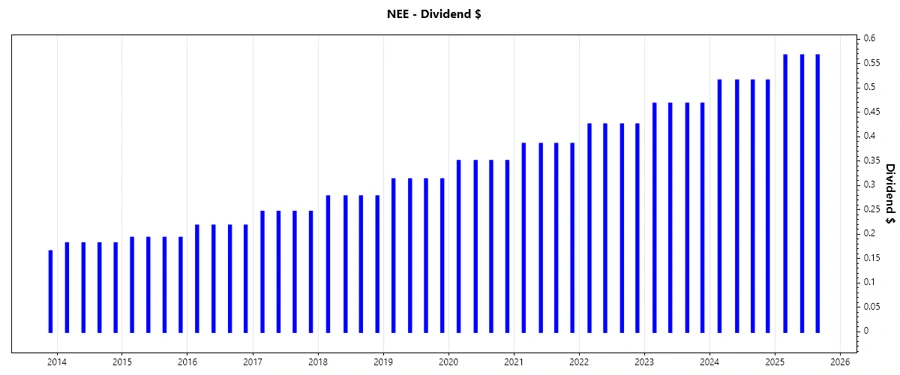
| Year | Dividend Per Share (USD) |
|---|---|
| 2025 | $1.70 |
| 2024 | $2.06 |
| 2023 | $1.87 |
| 2022 | $1.70 |
| 2021 | $1.54 |
Dividend Growth 📈
Monitoring the dividend growth pattern offers insights into the company's capacity to enhance shareholder returns over time. NextEra Energy has consistently demonstrated growth in its dividends, which is a positive indicator of its ongoing financial health and management effectiveness.
| Time | Growth |
|---|---|
| 3 years | 10.18 % |
| 5 years | 10.51 % |
The average dividend growth is 10.51 % over 5 years. This shows moderate but steady dividend growth.
Payout Ratio ⚖️
The payout ratio is a key metric in evaluating dividend sustainability. NextEra's EPS-based payout ratio stands at 71.58%, while its free cash flow-based payout ratio is 51.05%. A balanced payout ratio ensures the company retains enough profit for growth while returning capital to shareholders.
| Key Figure | Ratio |
|---|---|
| EPS-based | 71.58 % |
| Free Cash Flow-based | 51.05 % |
The 71.58 % EPS payout ratio indicates a healthy return of earnings to investors while maintaining sufficient reserves for future operations and growth.
Cashflow & Capital Efficiency 🏦
Analyzing cash flows provides insight into the company's operational proficiency and capital utilization. The data presented highlights NextEra's efficiency in managing financial resources and its ability to generate adequate free cash flow to meet obligations and pursue growth ventures.
| Metric | 2024 | 2023 | 2022 |
|---|---|---|---|
| Free Cash Flow Yield | 3.22 % | 1.42 % | -0.90 % |
| Earnings Yield | 4.71 % | 5.94 % | 2.51 % |
| CAPEX to Operating Cash Flow | 64.21 % | 84.49 % | 117.91 % |
| Stock-based Compensation to Revenue | 0 % | 0 % | 0.68 % |
| Free Cash Flow / Operating Cash Flow Ratio | 35.79 % | 15.51 % | -17.91 % |
| Return on Invested Capital | 4.04 % | 5.47 % | 2.44 % |
The figures suggest that, while the company is effectively using its capital, fluctuations in free cash flow yield highlight areas for potential improvement in cash management.
Balance Sheet & Leverage Analysis 💼
The balance sheet metrics shed light on the company's leverage and overall financial health. An understanding of these figures helps in assessing the company's debt management strategy and its effectiveness in maintaining financial stability.
| Metric | 2024 | 2023 | 2022 |
|---|---|---|---|
| Debt-to-Equity | 1.64 | 1.54 | 1.66 |
| Debt-to-Assets | 43.30 % | 41.25 % | 40.88 % |
| Debt-to-Capital | 62.17 % | 60.67 % | 62.35 % |
| Net Debt to EBITDA | 5.76 | 4.21 | 6.88 |
| Current Ratio | 0.47 | 0.55 | 0.51 |
| Quick Ratio | 0.38 | 0.47 | 0.43 |
| Financial Leverage | 3.80 | 3.74 | 4.05 |
The balance sheet reveals a relatively high leverage with consistent debt ratios, indicating a need for continued focus on debt management to safeguard financial stability.
Fundamental Strength & Profitability 📉
A detailed examination of profitability metrics helps evaluate the company's operational efficiency. These figures are vital for stakeholders to understand the company's ability to generate profits from its resources.
| Metric | 2024 | 2023 | 2022 |
|---|---|---|---|
| Return on Equity | 13.86 % | 15.40 % | 10.57 % |
| Return on Assets | 3.65 % | 4.12 % | 2.61 % |
| Net Profit Margin | 28.06 % | 26.00 % | 19.79 % |
| EBIT Margin | 33.42 % | 37.75 % | 21.08 % |
| Gross Profit Margin | 60.06 % | 63.94 % | 48.38 % |
| Research & Development to Revenue | 0 % | 0 % | 0 % |
NextEra Energy's profitability metrics demonstrate a solid capacity to generate returns, with stable margins indicating effective cost management despite competitive pressures.
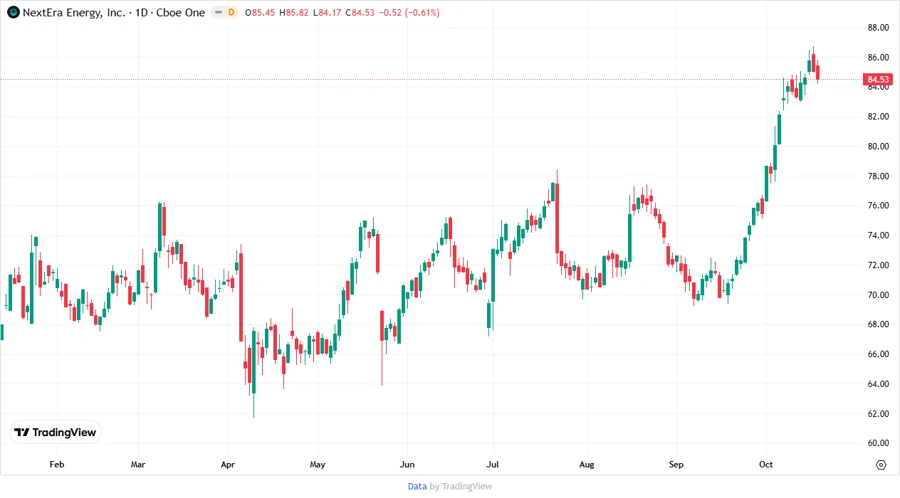
Price Development 📈
Dividend Scoring System ✅
An objective scoring system assessing various metrics provides transparency in dividend evaluations. Each factor in the scoring system ranges from 1 (poor) to 5 (excellent).
| Criteria | Score | Score Bar |
|---|---|---|
| Dividend Yield | 4 | |
| Dividend Stability | 5 | |
| Dividend Growth | 4 | |
| Payout Ratio | 3 | |
| Financial Stability | 3 | |
| Dividend Continuity | 5 | |
| Cashflow Coverage | 3 | |
| Balance Sheet Quality | 3 |
Total Score: 30/40
Rating ⭐
The analysis of NextEra Energy, Inc. suggests a strong dividend performance backed by consistent historical growth and stability. With sound fundamentals and a balanced payout ratio, NextEra exemplifies a sturdy choice for dividend-seeking investors. While leverage is somewhat high, the company maintains adequate operational efficiency and shareholder returns. Overall, NextEra Energy, Inc. is thus recommended as a reliable dividend stock.
Smart Data Insight
Master the Perfect Entry & Exit for this Stock
Don't leave your profits to chance. Historically, this stock follows specific seasonal patterns that institutional traders use to maximize returns.
- ✅ Identify the "Golden Buying Window"
- ✅ Avoid high-risk correction cycles
- ✅ Backtested data from the last 20+ years