August 31, 2025 a 03:31 pm


NEE: Dividend Analysis - NextEra Energy, Inc.
NextEra Energy, Inc. showcases a resilient dividend profile with a solid history of consistent payments and growth. Positioned within the energy sector, it offers investors a dividend yield of 3.07%, bolstered by a 44-year history of uninterrupted payments, embodying reliability in uncertain markets. Despite a challenging financial environment, NextEra remains an enticing prospect for income-focused investors.
📊 Overview
NextEra Energy is a key player in the energy sector, offering a dividend yield of 3.07%, significantly higher than many of its peers. With a robust history of paying out dividends for 44 years, it stands as a beacon of stability for investors. The absence of any recent dividend cuts or suspensions further underscores the company's resilience and commitment to returning value to shareholders.
| Metric | Details |
|---|---|
| Sector | Energy |
| Dividend Yield | 3.07% |
| Current Dividend per Share | $2.06 USD |
| Dividend History | 44 years |
| Last Cut or Suspension | None |
📉 Dividend History
The company's long-standing track record of steady dividends reflects its commitment to investors. Such a history is critical as it reassures investors of the company's financial health and its prioritization of shareholder returns.
| Year | Dividend per Share (USD) |
|---|---|
| 2025 | $1.70 |
| 2024 | $2.06 |
| 2023 | $1.87 |
| 2022 | $1.70 |
| 2021 | $1.54 |
📈 Dividend Growth
The growth trajectory of NextEra Energy's dividends is a testament to its strategic financial management. Steady dividend growth over years indicates robust cash flows and a positive outlook for dividend sustainability.
| Time | Growth |
|---|---|
| 3 years | 10.18% |
| 5 years | 10.51% |
The average dividend growth is 10.51% over 5 years. This shows moderate but steady dividend growth, which is an encouraging sign for longer-term investors seeking increasing income streams.
🗣️ Payout Ratio
Payout ratios are crucial in assessing the sustainability of a company's dividend policy. While high ratios may signal potential risk if earnings fluctuate, moderate levels often indicate healthy shareholder returns.
| Key Figure | Ratio |
|---|---|
| EPS-based | 71.58% |
| Free Cash Flow-based | 51.05% |
The EPS payout ratio of 71.58% and FCF payout ratio of 51.05% might suggest that the company is efficiently using its earnings to support dividends while still investing in future growth.
💼 Cashflow & Capital Efficiency
The robustness of cash flows and capital efficiency measures a company's ability to generate free cash for dividends and growth investments.
| Year | 2024 | 2023 | 2022 |
|---|---|---|---|
| Free Cash Flow Yield | 3.22% | 1.42% | -0.90% |
| Earnings Yield | 4.71% | 5.94% | 2.51% |
| CAPEX to Operating Cash Flow | 64.21% | 84.49% | 117.91% |
| Stock-based Compensation to Revenue | 0% | 0% | 0.68% |
| Free Cash Flow / Operating Cash Flow Ratio | 35.79% | 15.51% | -17.91% |
| Return on Invested Capital | 4.04% | 5.47% | 2.44% |
The company's cash flow generation and capital efficiency metrics indicate a stable revenue base, although occasional negative free cash flows could warrant closer scrutiny in volatile periods.
⚙️ Balance Sheet & Leverage Analysis
Examining leverage and liquidity provides insights into a company's financial health and operational resilience during market fluctuations.
| Year | 2024 | 2023 | 2022 |
|---|---|---|---|
| Debt-to-Equity | 164.33% | 154.23% | 165.61% |
| Debt-to-Assets | 43.30% | 41.25% | 40.88% |
| Debt-to-Capital | 62.17% | 60.67% | 62.35% |
| Net Debt to EBITDA | 5.76 | 4.21 | 6.88 |
| Current Ratio | 54.21% | 54.93% | 50.53% |
| Quick Ratio | 38.40% | 47.40% | 43.29% |
| Financial Leverage | 3.80 | 3.74 | 4.05 |
NextEra's strategic use of leverage has provided capital for growth, although the high net debt-to-EBITDA ratios suggest an area for improvement to enhance long-term financial stability.
🏦 Fundamental Strength & Profitability
Analyzing core fundamental indicators reveals the inner workings of the company’s profitability and long-term growth potential.
| Year | 2024 | 2023 | 2022 |
|---|---|---|---|
| Return on Equity | 13.86% | 15.40% | 10.57% |
| Return on Assets | 3.65% | 4.12% | 2.61% |
| Net Margin | 28.06% | 26.00% | 19.79% |
| EBIT Margin | 33.42% | 37.75% | 21.08% |
| EBITDA Margin | 56.69% | 59.63% | 43.93% |
| Gross Margin | 60.06% | 63.94% | 48.38% |
| R&D to Revenue | 0% | 0% | 0% |
Enhanced profitability metrics highlight NextEra's systematic efficiency and its effective strategies to maximize shareholder returns, demonstrating solid financial stewardship.
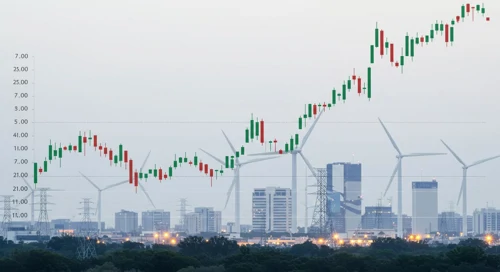
📈 Price Development
🔍 Dividend Scoring System
| Category | Details | Score |
|---|---|---|
| Dividend Yield | 3.07% | 3 |
| Dividend Stability | 44 Years Stability | 4 |
| Dividend Growth | 10.51% over 5 years | 4 |
| Payout Ratio | EPS 71.58%, FCF 51.05% | 3 |
| Financial Stability | Debt heavy | 2 |
| Dividend Continuity | No Cuts | 5 |
| Cashflow Coverage | Moderate | 3 |
| Balance Sheet Quality | Leverage at 3.80x | 3 |
Total Score: 27/40
✅ Rating
NextEra Energy, Inc. exhibits a robust dividend profile underpinned by significant growth and stability metrics, making it an appealing choice for dividend-seeking investors. The company currently holds a well-rounded score in our analysis, indicating a moderate to strong buy recommendation for income-oriented portfolios amid evolving market conditions.
Smart Data Insight
Master the Perfect Entry & Exit for this Stock
Don't leave your profits to chance. Historically, this stock follows specific seasonal patterns that institutional traders use to maximize returns.
- ✅ Identify the "Golden Buying Window"
- ✅ Avoid high-risk correction cycles
- ✅ Backtested data from the last 20+ years