August 05, 2025 a 03:31 pm

NEE: Dividend Analysis - NextEra Energy, Inc.
NextEra Energy, Inc. presents a compelling dividend profile with a steady dividend history and consistent growth over the years. The company maintains a healthy dividend payout ratio, balancing between rewarding shareholders and reinvesting in growth. However, the high payout ratios relative to earnings may suggest potential constraints for future dividend increases unless earnings grow significantly.
📊 Overview
The overview of NextEra Energy's dividend profile highlights a stable offer within the Utilities sector, characterized by a robust history of uninterrupted dividend payments spanning decades.
| Attribute | Details |
|---|---|
| Sector | Utilities |
| Dividend yield | 3.14 % |
| Current dividend per share | 2.06 USD |
| Dividend history | 44 years |
| Last cut or suspension | None |
🗣️ Dividend History
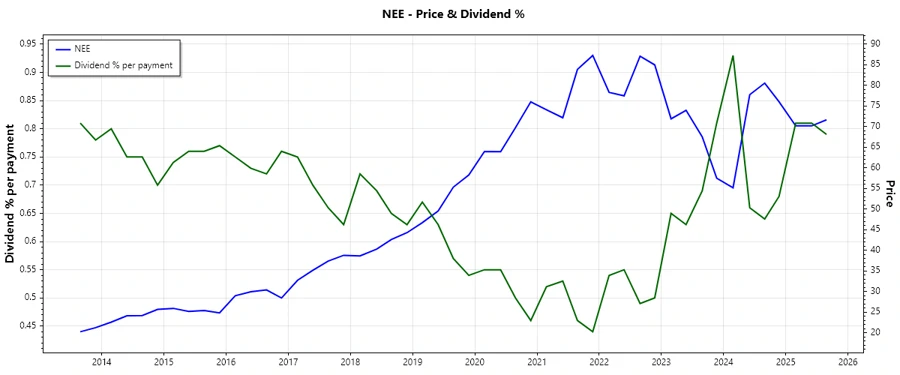
Examining NextEra Energy's dividend history reveals a consistent pattern of incremental increases, signaling reliability and investor-friendly policies. This stability is crucial for income-focused investors seeking predictable cash flows.
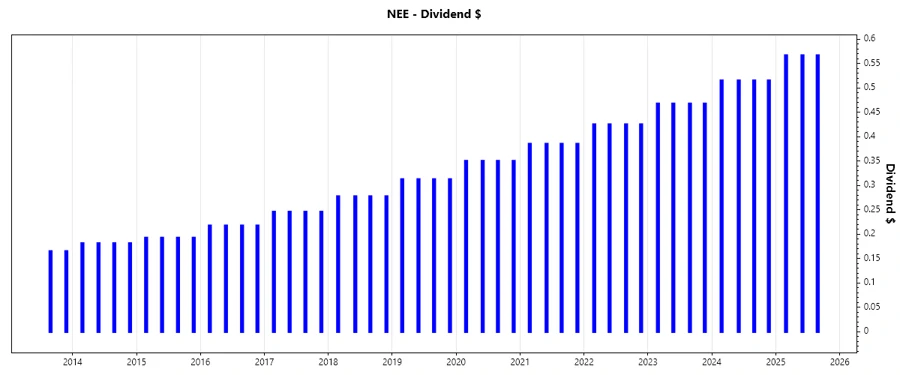
| Year | Dividend Per Share (USD) |
|---|---|
| 2025 | 1.70 |
| 2024 | 2.06 |
| 2023 | 1.87 |
| 2022 | 1.70 |
| 2021 | 1.54 |
📈 Dividend Growth
Dividend growth analysis highlights NextEra Energy's commitment to rewarding shareholders with increasing returns. The moderate growth reflects a stable strategy while maintaining balance sheet strength.
| Time | Growth |
|---|---|
| 3 years | 10.18 % |
| 5 years | 10.51 % |
The average dividend growth is 10.51 % over 5 years. This shows moderate but steady dividend growth.
⚠️ Payout Ratio
NextEra Energy's payout ratios provide insights into the sustainability of its dividend payments. Balancing EPS-based and Free Cash Flow-based metrics ensures a comprehensive view of financial health.
| Key Figure | Ratio |
|---|---|
| EPS-based | 71.54 % |
| Free cash flow-based | 51.05 % |
While the payout ratio based on EPS is on the higher side at 71.54 %, it remains sustainable given the coverage offered by the Free Cash Flow ratio of 51.05 %.
✅ Cashflow & Capital Efficiency
The cash flow and capital efficiency metrics provide a vital snapshot of how effectively NextEra Energy generates and utilizes its cash.
| Metric | 2024 | 2023 | 2022 |
|---|---|---|---|
| Free Cash Flow Yield | 3.22 % | 1.42 % | -0.90 % |
| Earnings Yield | 4.71 % | 5.94 % | 1.97 % |
| CAPEX to Operating Cash Flow | 64.21 % | 84.49 % | 117.91 % |
| Stock-based Compensation to Revenue | 0 % | 0 % | 0.68 % |
| Free Cash Flow / Operating Cash Flow Ratio | 35.79 % | 15.51 % | -17.91 % |
Overall, NextEra Energy demonstrates solid cash flow metrics, though the negative free cash flow yield in 2022 indicates prior year stock-based compensation affects financial optimization.
⚖️ Balance Sheet & Leverage Analysis
Understanding the financial leverage and balance sheet quality offers insights into the company's financial resilience.
| Metric | 2024 | 2023 | 2022 |
|---|---|---|---|
| Debt-to-Equity | 1.64 | 1.54 | 1.66 |
| Debt-to-Assets | 43.30 % | 41.25 % | 40.88 % |
| Debt-to-Capital | 62.17 % | 60.67 % | 62.35 % |
| Net Debt to EBITDA | 5.76 | 4.21 | 6.12 |
| Current Ratio | 0.54 | 0.55 | 0.51 |
| Quick Ratio | 0.38 | 0.47 | 0.43 |
| Financial Leverage | 3.80 | 3.74 | 4.05 |
The company's leverage metrics suggest adequate financial flexibility, but the relatively high debt-to-equity and net debt to EBITDA ratios warrant cautious monitoring.
🏦 Fundamental Strength & Profitability
Evaluating profitability margins and fundamental strength provides a clear picture of Operational efficiency and competitive standing.
| Metric | 2024 | 2023 | 2022 |
|---|---|---|---|
| Return on Equity | 13.86 % | 15.40 % | 8.27 % |
| Return on Assets | 3.65 % | 4.12 % | 2.04 % |
| Net Margin | 28.06 % | 26.00 % | 15.49 % |
| EBIT Margin | 33.42 % | 37.75 % | 21.08 % |
| EBITDA Margin | 56.69 % | 59.63 % | 49.43 % |
| Gross Margin | 60.06 % | 63.94 % | 48.38 % |
| R&D to Revenue | 0 % | 0 % | 0 % |
NextEra Energy shows solid profitability with potential for increased return on equity, given its operational margins are well-maintained.
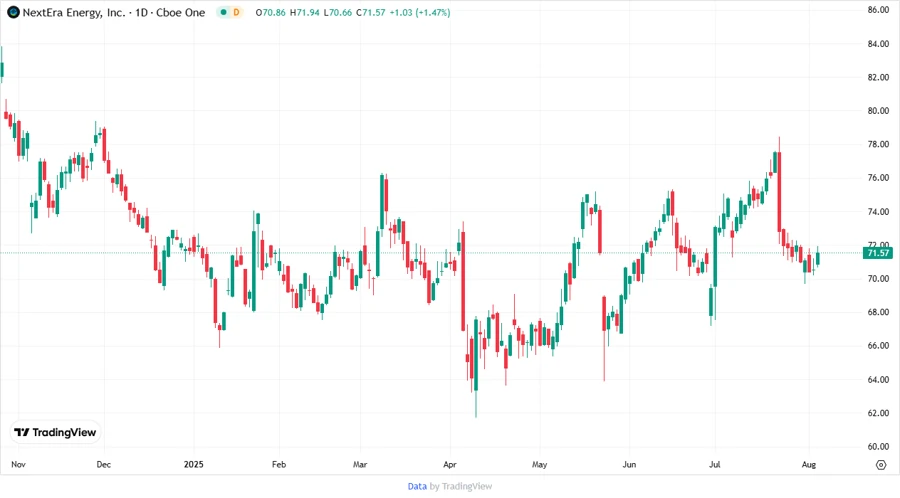
💹 Price Development
⭐ Dividend Scoring System
| Criteria | Score | Score Bar |
|---|---|---|
| Dividend yield | 4 | |
| Dividend Stability | 5 | |
| Dividend growth | 3 | |
| Payout ratio | 4 | |
| Financial stability | 3 | |
| Dividend continuity | 5 | |
| Cashflow Coverage | 4 | |
| Balance Sheet Quality | 3 |
Total Score: 31/40
📝 Rating
Overall, NextEra Energy, Inc. demonstrates robust dividend credentials with a stable yet modest growth trajectory. The company's dividend yield and continuity metrics are particularly strong, making it a viable long-term investment for income-focused portfolios. However, investors should monitor the leveraged financial structure for any signs of increased risk. On balance, NextEra Energy, Inc. can be recommended as a stable addition to a diversified dividend portfolio.
Smart Data Insight
Master the Perfect Entry & Exit for this Stock
Don't leave your profits to chance. Historically, this stock follows specific seasonal patterns that institutional traders use to maximize returns.
- ✅ Identify the "Golden Buying Window"
- ✅ Avoid high-risk correction cycles
- ✅ Backtested data from the last 20+ years