
July 20, 2026 a 02:03 pm
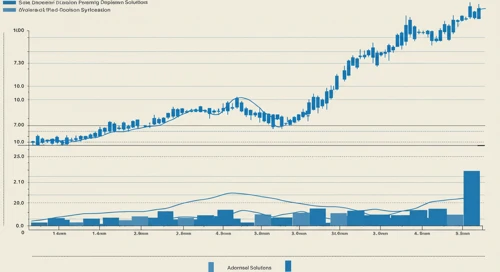


NDSN: Trend and Support & Resistance Analysis - Nordson Corporation
Nordson Corporation has been experiencing notable fluctuations in its stock price over the last months. As a leader in dispensing, coating, and laminating systems, the company's diverse portfolio and innovative solutions have made it a reliable entity in the industrial precision sector. Despite recent market turbulence, its robust engineering capabilities and strong market presence provide a steady foundation for growth. This analysis aims to look into the technical trends, identifying key support and resistance zones for better investment insights.
Trend Analysis
The technical analysis of Nordson Corporation's stock over recent months shows variations in price trends. To understand the present trend, we calculate the EMA20 and EMA50 from the closing prices of the last trading days. This provides insight into the short-term and long-term trend dynamics.
| Date | Closing Price | Trend |
|---|---|---|
| 2026-07-20 | $288.35 | ▼ |
| 2026-07-17 | $288.98 | ▲ |
| 2026-07-16 | $293.36 | ▲ |
| 2026-07-15 | $287.77 | ▼ |
| 2026-07-14 | $286.83 | ▼ |
| 2026-07-13 | $286.59 | ⚖️ |
| 2026-07-10 | $286.60 | ⚖️ |
The EMA20 is currently lower than the EMA50, suggesting a prevailing short-term downtrend in the stock's price. Such trends indicate potential resistance to immediate price increases, but careful attention to upcoming data is recommended.
Support- and Resistance
Determining key zones of support and resistance is critical for understanding potential market movements. These zones are derived by analyzing historical price fluctuations.
| Type | From | To |
|---|---|---|
| Support | 284.00 | 286.00 |
| Support | 275.00 | 277.00 |
| Resistance | 294.00 | 296.00 |
| Resistance | 302.00 | 304.00 |
The current price sits near the upper support zone, suggesting a potential rebound opportunity provided the support holds steady. If it breaches below, it may seek the next support level.
Conclusion
The Nordson Corporation shows a short-term descending trend, backed by technical indicators like the EMA20 remaining below the EMA50. This suggests vigilance in monitoring for any downside breakout. However, strong support zones provide areas of potential price stabilization, fostering confidence for ongoing investments. Risks are associated with breaching these zones, but opportunities lie in observing rebounding patterns, particularly given Nordson's fundamental strengths and market standing. Overall, the stock's present movement compels a balanced strategy for analysts focused on harnessing both trend dynamics and support levels.
Smart Data Insight
Master the Perfect Entry & Exit for this Stock
Don't leave your profits to chance. Historically, this stock follows specific seasonal patterns that institutional traders use to maximize returns.
- ✅ Identify the "Golden Buying Window"
- ✅ Avoid high-risk correction cycles
- ✅ Backtested data from the last 20+ years