February 12, 2026 a 01:15 pm
NDSN: Trend and Support & Resistance Analysis - Nordson Corporation
The Nordson Corporation (NDSN) has demonstrated resilience and growth through its specialized solutions in the industrial sector. Their advanced technology solutions cater to a wide range of industries, highlighting a robust business model. Recent market data indicates a definitive trend that merits closer examination for investment. Observing recent price movements and averages could yield insights into potential future trajectories.
Trend Analysis
| Date | Close Price | Trend |
|---|---|---|
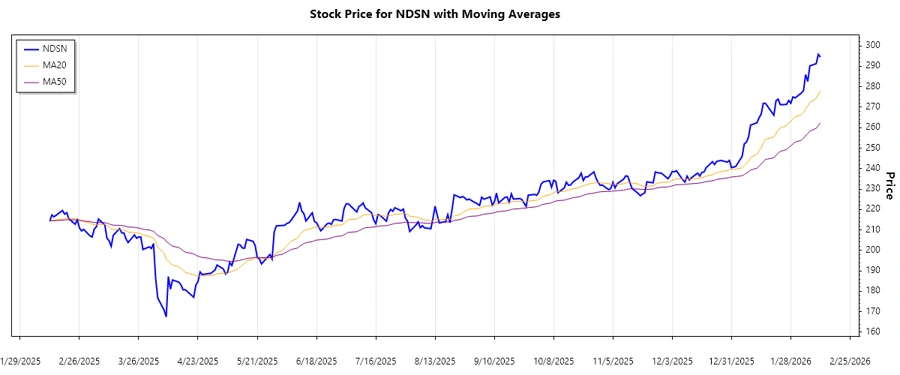
| 2026-02-11 | 294.47 | ▲ Up |
| 2026-02-10 | 295.8 | ▲ Up |
| 2026-02-09 | 291.26 | ▲ Up |
| 2026-02-06 | 290.18 | ▲ Up |
| 2026-02-05 | 282.57 | ▲ Up |
| 2026-02-04 | 285.95 | ▲ Up |
| 2026-02-03 | 278.17 | ▲ Up |
The continuously increasing EMA20 exceeding the EMA50 over the past week signifies a strong upward trend for Nordson Corporation, implying potential bullish sentiment among investors.
Support and Resistance
| Zone Type | Price From | Price To | Status |
|---|---|---|---|
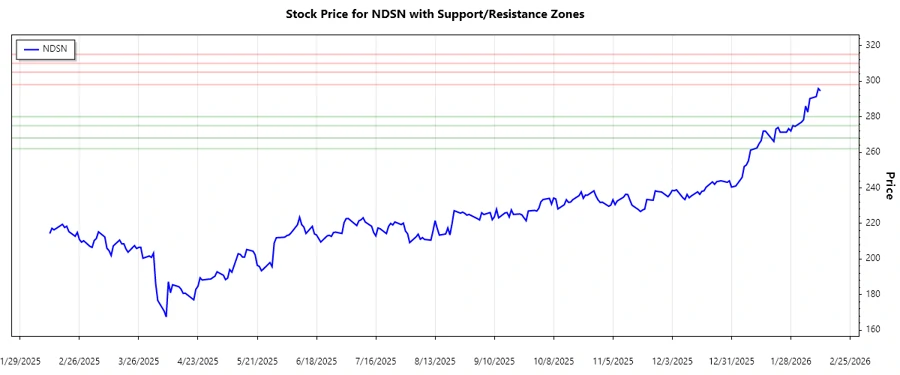
| Support Zone 1 | 275 | 280 | ▲ Above |
| Support Zone 2 | 262 | 268 | ▲ Above |
| Resistance Zone 1 | 298 | 305 | ▼ Below |
| Resistance Zone 2 | 310 | 315 | ▼ Below |
The current price is hovering above significant support zones, suggesting strong support levels between 275 and 280. Investors should watch out for breaches beyond these levels for potential shifts in trend.
Conclusion
Nordson Corporation seems to be in a robust upward trend backed by strong support zones, indicating potential growth. However, it faces resistance between the 298 and 315 price zones. The trend is promising, but investors should remain vigilant for any market changes, especially at resistance levels. Successful breach above these resistance levels may signal further bullish prospects.