October 14, 2025 a 06:45 am
NDSN: Fibonacci Analysis - Nordson Corporation
The Nordson Corporation (NDSN) has shown a versatile approach in delivering precision technology and solutions across sectors. Thanks to its dynamic portfolio and historical resilience, it remains a promising equity for investors. Over recent months, the stock has displayed noticeable volatility but ultimately trended upwards from mid-2025, indicating potential strength amidst market fluctuations.
Fibonacci Analysis
| Details | Date | Price (USD) |
|---|---|---|
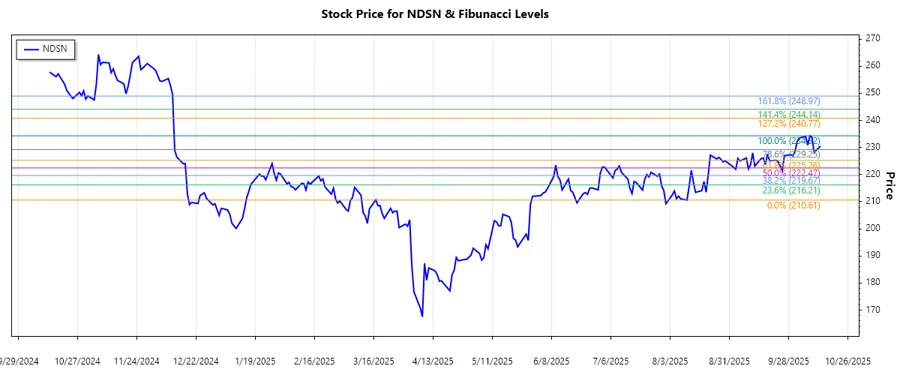
| Start of Trend | 2025-08-11 | 210.61 |
| End of Trend | 2025-10-13 | 230.52 |
| High | 2025-10-08 | 234.32 |
| Low | 2025-08-11 | 210.61 |
| Fibonacci Level | Price Level (USD) |
|---|---|
| 0.236 | 216.77 |
| 0.382 | 220.69 |
| 0.500 | 225.22 |
| 0.618 | 229.75 |
| 0.786 | 234.08 |
The stock is currently above the 0.618 retracement level, indicating strength. This suggests potential support at this level, with resistance likely near the 0.786 level.
Conclusion
Nordson Corporation's recent upward trend highlights a strong performance driven by market confidence and robust fundamentals. However, the considerable proximity to the 0.786 Fibonacci level suggests potential resistance that could challenge further appreciation. Analysts should remain vigilant, as the technical indicators highlight potential reversal risks. A thorough appraisal of external market factors should guide position adjustments. Maintaining a watchful strategy ensures seizing opportunities while mitigating volatility risks.
Smart Data Insight
Master the Perfect Entry & Exit for this Stock
Don't leave your profits to chance. Historically, this stock follows specific seasonal patterns that institutional traders use to maximize returns.
- ✅ Identify the "Golden Buying Window"
- ✅ Avoid high-risk correction cycles
- ✅ Backtested data from the last 20+ years