
April 24, 2026 a 07:46 am
NDSN: Dividend Analysis - Nordson Corporation
Nordson Corporation exhibits a well-established dividend trajectory with over four decades of consistent payments, reflecting stability and commitment to shareholder returns. While the current dividend yield might appear modest, the long history and disciplined payout ratio suggest reliability. The company’s prudent growth strategies and robust financial metrics highlight potential for sustained future dividend increments.
📊 Overview
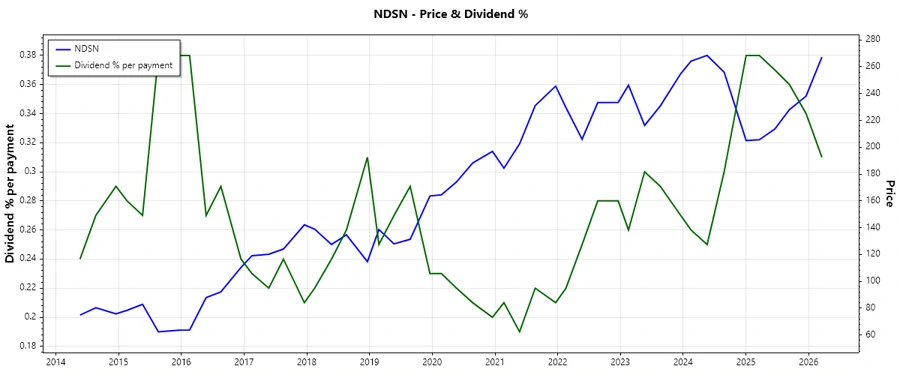
Nordson Corporation, a key player in its sector with a 1.21% dividend yield, showcases a strong dividend profile through decades of consistent payments. This track record enhances investor confidence, providing a glimpse into its strategic financial groundwork.
| Metric | Value |
|---|---|
| Sector | Industrial Machinery |
| Dividend yield | 1.21% |
| Current dividend per share | 3.16 USD |
| Dividend history | 41 years |
| Last cut or suspension | None |
📉 Dividend History
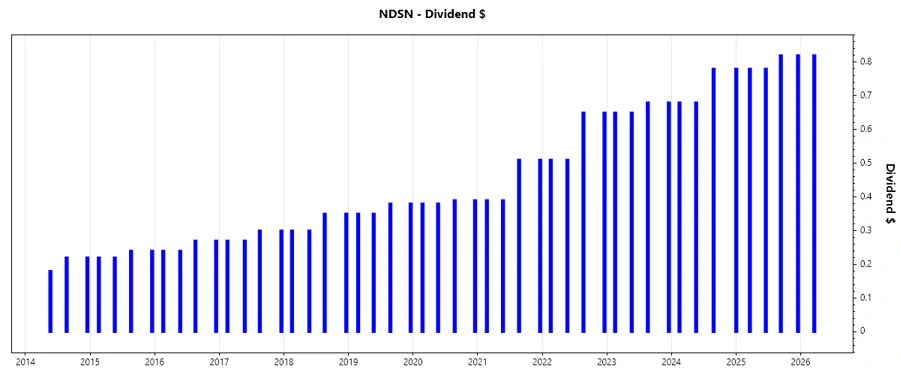
The longstanding dividend distribution by Nordson reinforces investor trust by demonstrating consistent profitability and robust cash flows. The absence of cuts or suspensions for over 41 years further underscores financial prudence and sustainability.
| Year | Dividend per Share (USD) |
|---|---|
| 2026 | 0.82 |
| 2025 | 3.98 |
| 2024 | 2.14 |
| 2023 | 2.66 |
| 2022 | 2.32 |
📈 Dividend Growth
The growth trajectory indicates moderate yet consistent dividend enhancements, essential for safeguarding against inflation and enhancing total returns for shareholders.
| Time | Growth |
|---|---|
| 3 years | 19.71% |
| 5 years | 20.91% |
The average dividend growth is 20.91% over 5 years. This shows moderate but steady dividend growth, indicative of powerful financial strategies driving shareholder value.
✅ Payout Ratio
A critical analysis of payout ratios indicates the effectiveness with which a company utilizes its earnings and cash flow to return value to shareholders.
| Key figure | Ratio |
|---|---|
| EPS-based | 33.73% |
| Free cash flow-based | 27.30% |
Nordson's low EPS (33.73%) and FCF (27.30%) payout ratios highlight considerable financial flexibility, suggesting solid coverage for dividend payments while allowing room for reinvestment opportunities and growth.
🗣️ Cashflow & Capital Efficiency
Robust cash flow efficiency is paramount for sustaining dividends and enabling reinvestment. Evaluating these metrics provides insight into operational effectiveness and investment return.
| Year | 2025 | 2024 | 2023 |
|---|---|---|---|
| Free Cash Flow Yield | 5.04% | 3.44% | 4.99% |
| Earnings Yield | 3.69% | 3.27% | 4.02% |
| CAPEX to Operating Cash Flow | 8.07% | 11.58% | 5.39% |
| Stock-based Compensation to Revenue | - | - | - |
| Free Cash Flow / Operating Cash Flow Ratio | 91.93% | 88.42% | 94.61% |
Nordson's consistent cash flow yield and efficient capital deployment capabilities highlight its healthy liquidity scenario, bolstering dividend sustainability potential alongside growth initiatives.
💼 Balance Sheet & Leverage Analysis
A well-balanced leverage structure alongside robust liquidity ratios ensures long-term financial health and stakeholder assurance.
| Year | 2025 | 2024 | 2023 |
|---|---|---|---|
| Debt-to-Equity | 0.71 | 0.82 | 0.75 |
| Debt-to-Assets | 36.45% | 40.01% | 37.23% |
| Debt-to-Capital | 41.47% | 45.02% | 42.94% |
| Net Debt to EBITDA | 2.34 | 2.82 | 2.34 |
| Current Ratio | 2.72 | 2.41 | 2.11 |
| Quick Ratio | 1.05 | 1.51 | 1.33 |
| Financial Leverage | 1.94 | 2.05 | 2.02 |
Nordson’s balance sheet reflects a controlled leverage approach, supporting robust liquidity with a solid current ratio and moderate debt-to-equity standings, thereby ensuring financial resilience.
🔍 Fundamental Strength & Profitability
Analyzing metrics such as return on equity and margins delivers insight into operational efficiency and profitability, crucial for long-term value creation.
| Year | 2025 | 2024 | 2023 |
|---|---|---|---|
| Return on Equity | 15.92% | 15.94% | 18.76% |
| Return on Assets | 8.19% | 7.79% | 9.28% |
| Margins: Net | 17.35% | 17.37% | 18.55% |
| EBIT | 25.94% | 25.07% | 25.67% |
| EBITDA | 31.335% | 30.13% | 29.93% |
| Gross | 55.16% | 55.25% | 54.23% |
| Research & Development to Revenue | 2.44% | 2.41% | 2.72% |
The company's steadfast profitability measures, bolstered by healthy ROE and robust margins, confirm foundational strength and strategic operational excellence, fostering upward financial trajectories.
📈 Price Development
💯 Dividend Scoring System
| Criteria | Score | Visual |
|---|---|---|
| Dividend yield | 3 / 5 | |
| Dividend Stability | 5 / 5 | |
| Dividend growth | 4 / 5 | |
| Payout ratio | 5 / 5 | |
| Financial stability | 5 / 5 | |
| Dividend continuity | 5 / 5 | |
| Cashflow Coverage | 4 / 5 | |
| Balance Sheet Quality | 4 / 5 |
Overall Score: 35/40
⭐ Rating
Nordson Corporation stands out as a disciplined dividend stock with a stellar track record of stability and resilience, embodying prudent financial strategies. Though the yield may not be the highest, the comprehensive strength across various financial metrics ensures its reliability as a solid investment choice, meriting a strong buy recommendation for risk-averse investors seeking steady income and capital appreciation.
Smart Data Insight
Master the Perfect Entry & Exit for this Stock
Don't leave your profits to chance. Historically, this stock follows specific seasonal patterns that institutional traders use to maximize returns.
- ✅ Identify the "Golden Buying Window"
- ✅ Avoid high-risk correction cycles
- ✅ Backtested data from the last 20+ years