November 02, 2025 a 03:31 am

NDSN: Dividend Analysis - Nordson Corporation
🏆 Nordson Corporation demonstrates a robust dividend profile with a consistent history of payments and a moderate growth trajectory. Despite a recent cut, its overall financial metrics denote a resilient payout capability, backed by solid financial stability. The company's commitment to shareholder returns is evident, although its yield remains modest compared to peers.
Overview 📊
The following table provides an overview of Nordson's key dividend metrics, reflecting its position in the industry.
| Sector | Dividend Yield (%) | Current Dividend Per Share (USD) | Dividend History (Years) | Last Cut/Suspension |
|---|---|---|---|---|
| Capital Goods | 1.39 | 2.80 | 40 | 2024 |
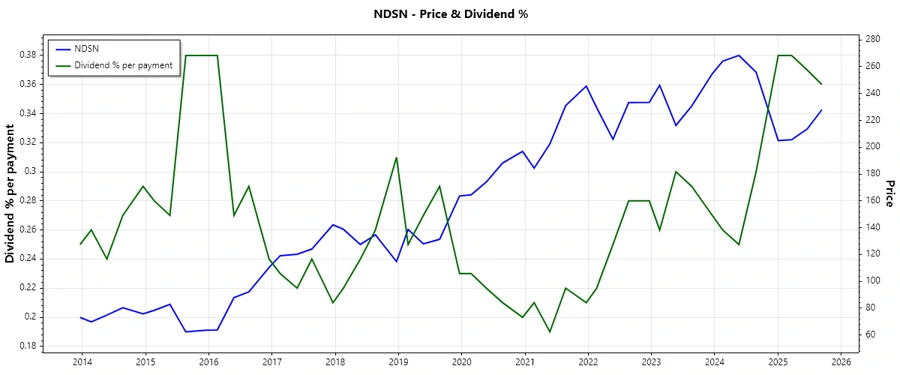
Dividend History 📜
Understanding the dividend history is crucial as it highlights the company's reliability in rewarding its shareholders through consistent payouts.
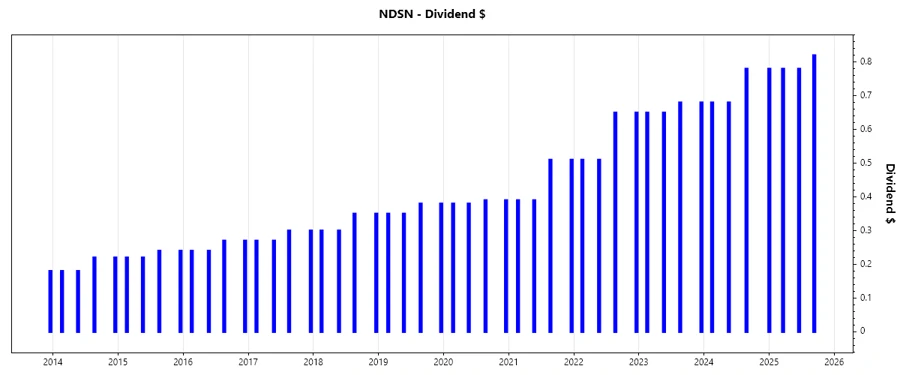
Recent Dividend Payments
| Year | Dividend Per Share (USD) |
|---|---|
| 2025 | 3.16 |
| 2024 | 2.14 |
| 2023 | 2.66 |
| 2022 | 2.32 |
| 2021 | 1.80 |
Dividend Growth 📈
Dividend growth is an indicator of the company's ability to increase payouts, reflecting its profitability and strategic growth priorities.
| Time | Growth |
|---|---|
| 3 years | 5.94% |
| 5 years | 7.95% |
The average dividend growth is 7.95% over 5 years. This shows moderate but steady dividend growth, indicating a positive trajectory for the firm's future dividend capability.
Payout Ratio 📉
The payout ratio examines how much of the company's earnings are distributed as dividends, indicating sustainability of dividends over the long term.
| Key Figure | Ratio |
|---|---|
| EPS-based | 34.97% |
| Free cash flow-based | 29.00% |
The payout ratios of 34.97% (EPS) and 29.00% (FCF) are relatively conservative, suggesting that Nordson has ample room to sustain or even increase its dividend payouts without overly straining its financials.
Cashflow & Capital Efficiency 💰
Cash flow analysis is key to understanding the company's operational efficiency and its ability to cover dividend payments and capital investments.
| Year | 2022 | 2023 | 2024 |
|---|---|---|---|
| Free Cash Flow Yield | 3.56% | 4.99% | 3.44% |
| Earnings Yield | 3.96% | 4.02% | 3.27% |
| CAPEX to Operating Cash Flow | 10.02% | 5.39% | 11.58% |
| Stock-based Compensation to Revenue | 1.19% | 0.86% | 0.00% |
| Free Cash Flow / Operating Cash Flow Ratio | 89.98% | 94.61% | 88.42% |
The company's cashflow indicators provide a stable outlook, with a strong free cash flow yield, reaffirming its ability to support dividends and reinvest in the business.
Balance Sheet & Leverage Analysis 📚
The balance sheet analysis offers insights into the company's financial health and its capacity to meet obligations while funding growth.
| Year | 2022 | 2023 | 2024 |
|---|---|---|---|
| Debt-to-Equity | 32.16% | 71.70% | 79.13% |
| Debt-to-Assets | 19.31% | 35.47% | 38.67% |
| Debt-to-Capital | 24.33% | 41.76% | 44.18% |
| Net Debt to EBITDA | 0.74 | 2.22 | 2.72 |
| Current Ratio | 1.36 | 2.11 | 2.41 |
| Quick Ratio | 0.89 | 1.33 | 1.51 |
| Financial Leverage | 1.67 | 2.02 | 2.05 |
The balance sheet indicates a moderate level of financial leverage with improving ratios, suggesting a balanced approach to debt management that ensures financial stability.
Fundamental Strength & Profitability 🔍
Profitability metrics offer insights into the efficiency of use of resources which affect both the company's competitive stance and its dividend perspectives.
| Year | 2022 | 2023 | 2024 |
|---|---|---|---|
| Return on Equity | 22.36% | 18.76% | 15.94% |
| Return on Assets | 13.43% | 9.28% | 7.79% |
| Net Margin | 19.81% | 18.55% | 17.37% |
| EBIT Margin | 25.93% | 25.67% | 25.07% |
| EBITDA Margin | 29.79% | 29.93% | 30.13% |
| Gross Margin | 55.07% | 54.23% | 55.25% |
| R&D to Revenue | 0% | 0% | 0% |
The profitability metrics underline Nordson's operational strength with strong returns relative to assets and equity, providing a sturdy foundation for ongoing dividend payments.
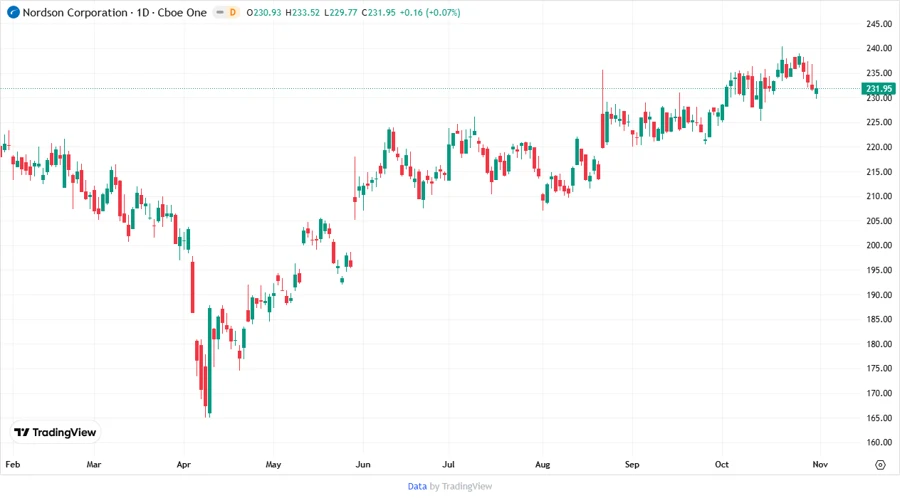
Price Development 📈📉
Dividend Scoring System 🗣️
| Category | Score | Visualization |
|---|---|---|
| Dividend Yield | 2 | |
| Dividend Stability | 4 | |
| Dividend Growth | 3 | |
| Payout Ratio | 5 | |
| Financial Stability | 4 | |
| Dividend Continuity | 3 | |
| Cashflow Coverage | 4 | |
| Balance Sheet Quality | 4 |
Total Score: 29/40
Rating ✅
In summary, Nordson Corporation's dividend profile is robust, marked by consistent growth and dependable payout ratios. With a dedication to returning value to shareholders, it stands out within its segment, albeit with a more conservative yield. Investors may view Nordson as a reliable long-term investment for dividend income, despite recent fluctuations in its yield.
Smart Data Insight
Master the Perfect Entry & Exit for this Stock
Don't leave your profits to chance. Historically, this stock follows specific seasonal patterns that institutional traders use to maximize returns.
- ✅ Identify the "Golden Buying Window"
- ✅ Avoid high-risk correction cycles
- ✅ Backtested data from the last 20+ years