April 30, 2026 a 10:15 am
NDAQ: Fibunacci Analysis - Nasdaq, Inc.
Nasdaq, Inc. has been a pivotal player in the technology sector serving capital markets globally. Recently, the stock has been experiencing a notable downward trend after reaching a peak earlier, followed by a correction phase that indicates investor uncertainties. This technical analysis aims to decode the future price movements using Fibonacci retracement levels as a guiding tool for potential support and resistance areas.
Fibonacci Analysis
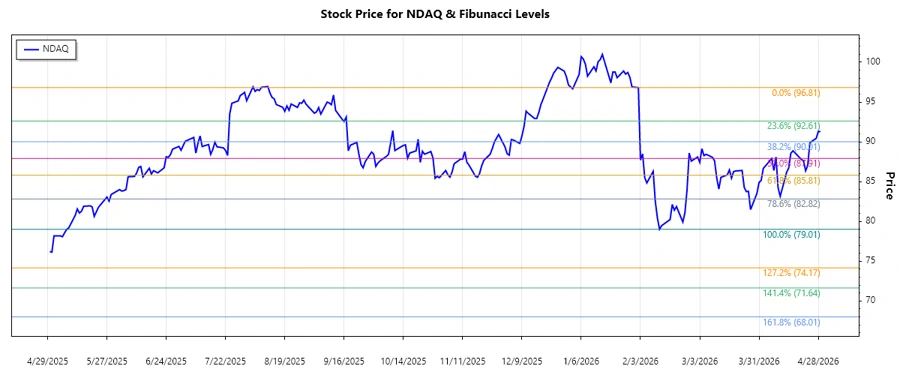
The latest data reflects a dominant downtrend for Nasdaq, Inc. spanning from February 2, 2026, to April 29, 2026. The high point of this trend occurred on February 2, 2026, with a peak price of $96.81. Subsequently, the market witnessed a drop to a low of $79.01 on February 12, 2026.
| Detail | Value |
|---|---|
| Trend Period | 2026-02-02 to 2026-04-29 |
| High | $96.81 (February 2, 2026) |
| Low | $79.01 (February 12, 2026) |
| Fibonacci Level | Price Level |
|---|---|
| 0.236 | $83.80 |
| 0.382 | $86.73 |
| 0.5 | $87.91 |
| 0.618 | $89.08 |
| 0.786 | $91.37 |
Current analysis indicates that the stock is hovering near the 0.5 retracement zone at the current price level, suggesting potential support at this level. If this holds, we could see bullish momentum; otherwise, a further slide towards deeper retracement levels is possible.
Conclusion
The Nasdaq, Inc. stock currently sits at a critical juncture within the 0.5 Fibonacci retracement level, highlighting the possibility of either a rebound or a continuation of the downtrend should support levels fail. For risk-tolerant investors, this offers an opportunity to capitalize on potential gains if support holds. However, caution is advised as any breach could see an acceleration towards lower retracement levels, demanding a vigilant eye for exit strategies. Overall, the current setup mandates a strategic approach for positions, considering Nasdaq, Inc.'s influential market role within the tech industry.