November 04, 2025 a 04:44 pm
NDAQ: Fibonacci Analysis - Nasdaq, Inc.
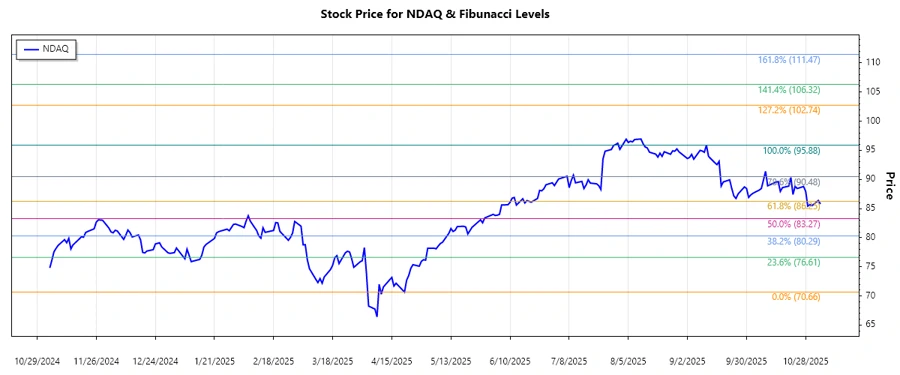
The Nasdaq, Inc. (NDAQ) has been experiencing a fluctuating market trend over the past months. Despite the fluctuations, the company's broad range of technological solutions and market services continue to provide a diversified revenue stream, positioning it well for long-term growth. Based on recent data, the dominant trend appears to be upward, with the stock demonstrating resilience amidst market volatility. This analysis employs the Fibonacci retracement tool to deepen the understanding of potential support and resistance levels.
Fibonacci Analysis
| Analysis Data | Details |
|---|---|
| Trend Start Date | 2024-11-04 |
| Trend End Date | 2025-11-04 |
| High Point | $95.88 (2025-09-11) |
| Low Point | $70.66 (2025-04-21) |
Fibonacci Retracement Levels
| Level | Price Level |
|---|---|
| 0.236 | $79.192 |
| 0.382 | $82.784 |
| 0.5 | $83.27 |
| 0.618 | $86.876 |
| 0.786 | $90.15 |
As of the current analysis, the stock price is at $85.79 (2025-11-04), which places it between the 0.5 and 0.618 retracement levels, indicating a potential support zone.
Technical interpretation suggests that the current price situated within this Fibonacci retracement region indicates a likely support level, which may prompt buying activity if investor sentiment is bullish.
Conclusion
The current upward trend for Nasdaq, Inc. suggests potential growth driven by its expansive technology and market services portfolio. However, analysts must consider market volatility and macroeconomic factors that could impact stock performance. The Fibonacci retracement analysis highlights significant price levels to watch, providing key insights for potential support or resistance. As the stock currently tests a key support level, there is a balanced risk-reward scenario contingent upon broader market conditions.
Smart Data Insight
Master the Perfect Entry & Exit for this Stock
Don't leave your profits to chance. Historically, this stock follows specific seasonal patterns that institutional traders use to maximize returns.
- ✅ Identify the "Golden Buying Window"
- ✅ Avoid high-risk correction cycles
- ✅ Backtested data from the last 20+ years