October 17, 2025 a 06:45 am
NDAQ: Fibonacci Analysis - Nasdaq, Inc.
Nasdaq, Inc. has showcased a notable trend over the past months with its operations reaching across various market segments and technologies. The stock has experienced fluctuations influenced by both market factors and internal developments. As a technology-driven company serving capital markets globally, their performance metrics significant impact investor anticipation. Recent trends provide a fascinating viewpoint into the technical structure of its market position. Analyzing Fibonacci retracement levels further offers insights into potential market behavior.
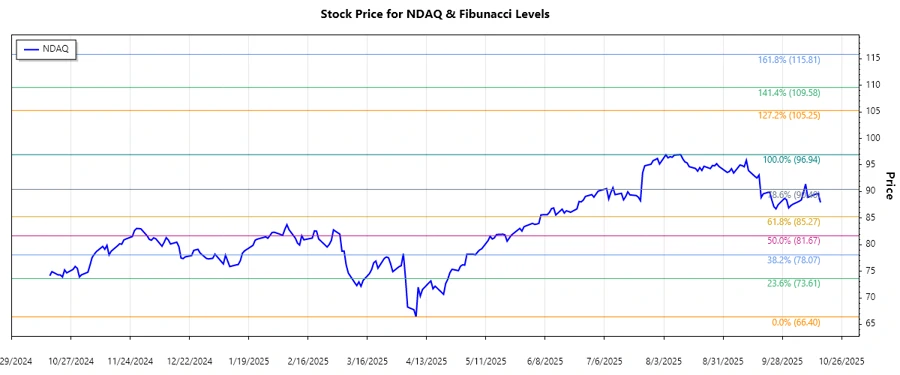
Fibonacci Analysis
| Attribute | Details |
|---|---|
| Start Date of Trend | 2025-04-02 |
| End Date of Trend | 2025-10-09 |
| High Point | $96.94 on 2025-08-11 |
| Low Point | $66.4 on 2025-04-08 |
| 0.236 Level | $73.74 |
| 0.382 Level | $79.27 |
| 0.5 Level | $81.67 |
| 0.618 Level | $84.07 |
| 0.786 Level | $88.01 |
The current price of $87.94 suggests it is within the 0.786 retracement level, which could indicate a potential resistance area. Technically, the significant retracement levels present both potential support and resistance zones that could guide future price action.
Conclusion
The recent analysis of Nasdaq, Inc.'s stock reveals an upward trend from the lows of $66.4 to the high of $96.94. The current retracement suggests a testing of resistance levels, offering opportunities for traders to identify pivotal market positions. While the Fibonacci levels provide insight into potential market support and resistance, the broader market dynamics and Nasdaq's strategic initiatives significantly influence price movements. Analysts should assess these figures alongside macroeconomic conditions and company-specific developments to forecast potential risks and opportunities appropriately. Overall, the stock remains poised at a critical juncture with balanced risk-reward potential.
Smart Data Insight
Master the Perfect Entry & Exit for this Stock
Don't leave your profits to chance. Historically, this stock follows specific seasonal patterns that institutional traders use to maximize returns.
- ✅ Identify the "Golden Buying Window"
- ✅ Avoid high-risk correction cycles
- ✅ Backtested data from the last 20+ years