October 08, 2025 a 05:15 am
NDAQ: Fibonacci Analysis - Nasdaq, Inc.
Nasdaq, Inc. operates in a dynamic business environment, catering to diverse capital markets and industries globally. Its strong market technology and data segment contribute to a robust business model. The recent trend indicates a potential recovery from prior lows, which could offer investment opportunities. However, external factors such as regulatory changes and technological disruptions remain key challenges.
Fibonacci Analysis
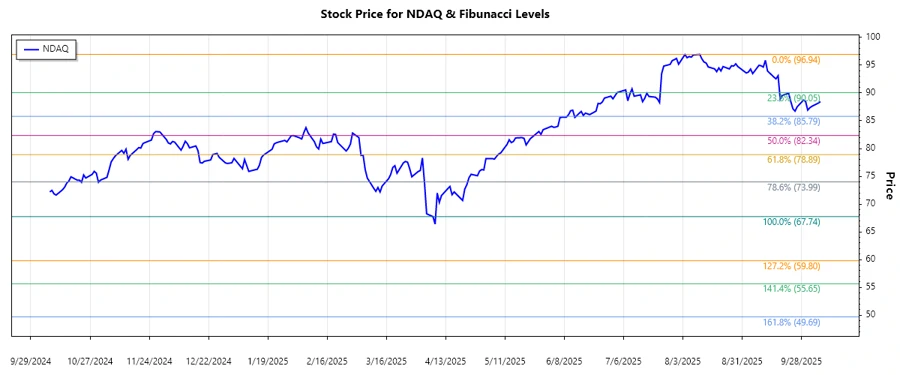
An analysis of the price data reveals that Nasdaq, Inc. has been experiencing a dominant downtrend over the assessed period. Below is a detailed Fibonacci retracement analysis based on the identified trend.
| Trend Details | Information |
|---|---|
| Start Date | 2024-10-08 |
| End Date | 2025-10-07 |
| High Price (Date) | $96.94 (2025-08-11) |
| Low Price (Date) | $67.74 (2025-04-07) |
| Current Price | $88.44 (2025-10-07) |
| Fibonacci Level | Price Level |
|---|---|
| 0.236 | $77.37 |
| 0.382 | $81.63 |
| 0.5 | $84.34 |
| 0.618 | $87.06 |
| 0.786 | $91.12 |
The current price of $88.44 is situated between the 0.618 and 0.786 retracement levels, indicating that the stock may find temporary support here. Technically, if the price breaks above the 0.786 level, further upside momentum can be expected.
Conclusion
The current analysis highlights a tentative recovery in Nasdaq, Inc.'s stock price. With the current price in the retracement zone, investors should watch for a break above the 0.786 Fibonacci level as it may signal a shift in trend. However, ongoing market volatility and external economic conditions could pose risks to this bullish argument. Analysts should remain vigilant for any significant changes in Nasdaq's operational performance or regulatory landscape, which could impact future price movements.
Smart Data Insight
Master the Perfect Entry & Exit for this Stock
Don't leave your profits to chance. Historically, this stock follows specific seasonal patterns that institutional traders use to maximize returns.
- ✅ Identify the "Golden Buying Window"
- ✅ Avoid high-risk correction cycles
- ✅ Backtested data from the last 20+ years