
July 17, 2026 a 12:46 pm

NDAQ: Dividend Analysis - Nasdaq, Inc.
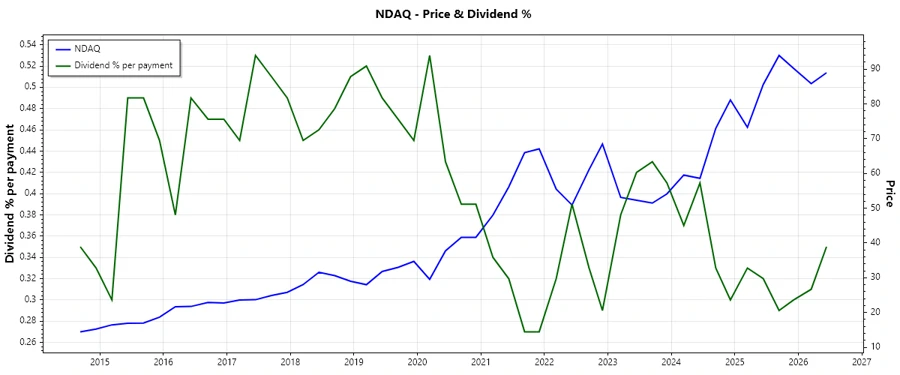
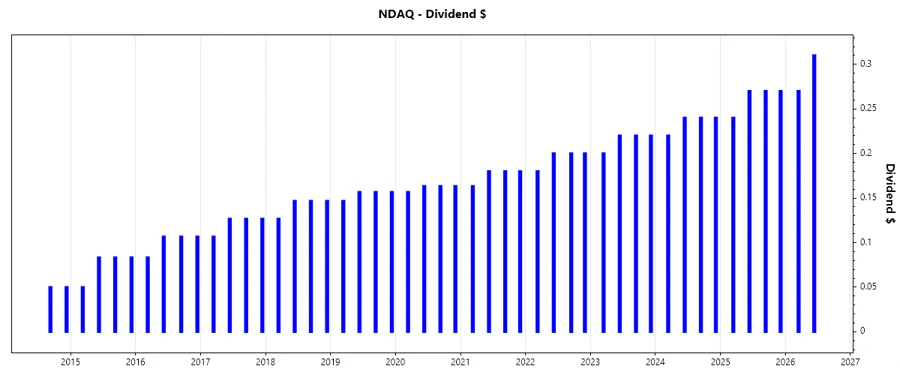
Nasdaq, Inc. presents a steadfast dividend profile, with a history of consistent payments and growth over the years, making it an appealing choice for dividend-focused investors. The firm maintains a disciplined payout ratio, reflecting its commitment to returning capital to shareholders while ensuring financial stability. Recent years have shown moderate growth, indicating a steady progression in its dividend strategy. This analysis will delve deeper into the various aspects of Nasdaq’s dividend metrics and their implications.
📊 Overview
Nasdaq operates within a dynamic sector, providing essential services in financial markets. A current dividend yield at 1.26% suggests a modest return from dividends relative to its share price.
| Indicator | Value |
|---|---|
| Sector | Financial Services |
| Dividend yield | 1.26% |
| Current dividend per share | 1.05 USD |
| Dividend history | 15 years |
| Last cut or suspension | None |
📈 Dividend History
The dividend history of Nasdaq, Inc. underscores its reliability and commitment to returning capital to shareholders. With 15 years of uninterrupted dividends, the company demonstrates a strong shareholder-oriented approach. The absence of cuts or suspensions further bolsters investor confidence.
| Year | Dividend per Share (USD) |
|---|---|
| 2026 | 0.58 |
| 2025 | 1.05 |
| 2024 | 0.94 |
| 2023 | 0.86 |
| 2022 | 0.78 |
🗣️ Dividend Growth
It's critical to evaluate dividend growth for insights into a company's future payout potential. Nasdaq exhibits a 10.12% growth over 5 years, suggesting steady appreciation in dividends, albeit at a moderate pace.
| Time | Growth |
|---|---|
| 3 years | 10.42% |
| 5 years | 10.18% |
The average dividend growth is 10.18% over 5 years. This shows moderate but steady dividend growth.
✅ Payout Ratio
The payout ratio indicates the proportion of earnings distributed as dividends, providing insights into sustainability and financial health. A balanced ratio attracts income-focused investors while enabling internal investment growth.
| Key figure | Ratio |
|---|---|
| EPS-based | 31.20% |
| Free cash flow-based | 29.72% |
With an EPS payout ratio of 31.20% and an FCF-based payout ratio of 29.72%, Nasdaq maintains a comfortable margin, ensuring dividend affordability and room for growth.
📉 Cashflow & Capital Efficiency
Analyzing cash flow metrics is essential to understanding a company’s capital efficiency and operational proficiency. This section highlights Nasdaq’s ability to generate and efficiently utilize its cash flows in key strategic areas.
| Year | 2023 | 2024 | 2025 |
|---|---|---|---|
| Free Cash Flow Yield | 5.20% | 3.90% | 3.59% |
| Earnings Yield | 3.58% | 2.51% | 3.23% |
| CAPEX to Operating Cash Flow | 9.32% | 10.68% | 11.80% |
| Stock-based Compensation to Revenue | 2.01% | 1.91% | 2.01% |
| Free Cash Flow / Operating Cash Flow Ratio | 90.68% | 89.32% | 88.20% |
Nasdaq shows robust cash flow ratios, highlighting operational efficiency and sustainable capital reinvestments. The consistent free cash flow conversion rates signal effective cash utilization strategies.
⚠️ Balance Sheet & Leverage Analysis
Assessing the balance sheet and leverage provides insights into a company’s financial resilience and debt management, crucial for ensuring long-term stability and growth.
| Year | 2023 | 2024 | 2025 |
|---|---|---|---|
| Debt-to-Equity | 1.01 | 0.88 | 0.81 |
| Debt-to-Assets | 33.66% | 32.47% | 31.97% |
| Debt-to-Capital | 50.13% | 46.86% | 44.81% |
| Net Debt to EBITDA | 5.22 | 3.77 | 2.91 |
| Current Ratio | 1.01 | 0.98 | 1.01 |
| Quick Ratio | 1.01 | 0.99 | 1.01 |
| Financial Leverage | 2.99 | 2.72 | 2.54 |
Nasdaq shows improving leverage ratios and a sound debt framework, ensuring a balanced financial structure. The strong current and quick ratios reflect healthy liquidity levels.
💼 Fundamental Strength & Profitability
Analyzing fundamental strength gives insights into profitability measures and overall operational effectiveness, essential for evaluating investment potential.
| Year | 2023 | 2024 | 2025 |
|---|---|---|---|
| Return on Equity | 9.79% | 9.98% | 14.63% |
| Return on Assets | 3.28% | 3.67% | 5.76% |
| Net Margin | 17.46% | 15.09% | 21.77% |
| EBIT Margin | 27.59% | 24.96% | 30.35% |
| EBITDA Margin | 32.92% | 33.24% | 38.05% |
| Gross Margin | 41.99% | 40.39% | 47.93% |
| R&D to Revenue | 0% | 0% | 0% |
Nasdaq's strong ROE and improving margins reflect solid management efficiency and the ability to generate significant profitability, emphasizing its competitive edge.
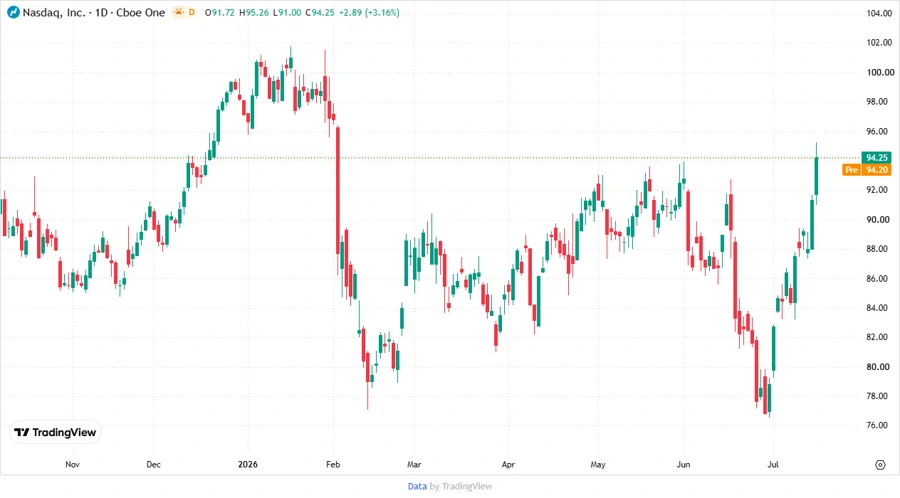
📊 Price Development
🏆 Dividend Scoring System
| Criteria | Score | Score Bar |
|---|---|---|
| Dividend yield | 3 | |
| Dividend Stability | 4 | |
| Dividend growth | 4 | |
| Payout ratio | 5 | |
| Financial stability | 4 | |
| Dividend continuity | 5 | |
| Cashflow Coverage | 4 | |
| Balance Sheet Quality | 4 |
Total Score: 33/40
🌟 Rating
Nasdaq, Inc. is a solid choice for dividend investors due to its historical dividend reliability, moderate growth, and strong payout ratios. Its financial health and strategic capital management further ensure stability and resilience. It’s well-suited for conservative investors seeking steady income generation from a financially robust company.
Smart Data Insight
Master the Perfect Entry & Exit for this Stock
Don't leave your profits to chance. Historically, this stock follows specific seasonal patterns that institutional traders use to maximize returns.
- ✅ Identify the "Golden Buying Window"
- ✅ Avoid high-risk correction cycles
- ✅ Backtested data from the last 20+ years