June 25, 2026 a 11:31 am


NDAQ: Dividend Analysis - Nasdaq, Inc.
Nasdaq, Inc., a predominant player in the exchange industry, offers a stable dividend profile. With a 15-year dividend history, its consistent payments have appealed to income-seeking investors. The company's moderate yield and recent dividend enhancements suggest a balanced approach to capital allocation, supporting growth and shareholder returns.
📊 Overview
The following table provides an at-a-glance look at the essential dividend metrics of Nasdaq, Inc., illustrating the company's commitment to returning value to its shareholders.
| Metric | Value |
|---|---|
| Sector: | Financials |
| Dividend yield: | 1.26% |
| Current dividend per share: | 1.05 USD |
| Dividend history: | 15 years |
| Last cut or suspension: | None |
🗣️ Dividend History
A solid dividend history is vital to understanding a company's financial health and its ability to maintain consistent payments. Nasdaq, Inc.'s track record highlights its financial robustness.
| Year | Dividend per Share (USD) |
|---|---|
| 2026 | 0.58 |
| 2025 | 1.05 |
| 2024 | 0.94 |
| 2023 | 0.86 |
| 2022 | 0.78 |
📈 Dividend Growth
Nasdaq, Inc. demonstrates a steady increase in dividends, indicative of corporate confidence in future earnings. It reflects the company's strong financial management and its focus on shareholder value.
| Time | Growth |
|---|---|
| 3 years | 10.42% |
| 5 years | 10.18% |
The average dividend growth is 10.18% over 5 years. This shows moderate but steady dividend growth.
📉 Payout Ratio
Payout ratios provide insight into the sustainability of the company's dividend payments from earnings and cash flows, essential for reliable dividends.
| Key figure | Ratio |
|---|---|
| EPS-based | 31.20% |
| Free cash flow-based | 29.72% |
The payout ratios indicate a conservative payout strategy, demonstrating the ability to sustain and possibly grow its dividend. An EPS payout ratio of 31.20% and an FCF payout ratio of 29.72% suggest ample room for financial maneuvering.
✅ Cashflow & Capital Efficiency
Breaking down cashflow elements helps gauge liquidity and operational efficiency. Capital efficiency metrics provide a deeper understanding of management's effectiveness.
| Year | 2025 | 2024 | 2023 |
|---|---|---|---|
| Free Cash Flow Yield | 3.59% | 3.90% | 5.20% |
| Earnings Yield | 3.23% | 2.51% | 3.58% |
| CAPEX to Operating Cash Flow | 11.20% | 10.68% | 9.32% |
| Stock-based Compensation to Revenue | 2.01% | 1.90% | 2.01% |
| Free Cash Flow / Operating Cash Flow Ratio | 88.20% | 89.32% | 90.68% |
The stability and growth in cash flows underscore Nasdaq, Inc.'s operational resilience and strategic resource allocation. Improving yields and capital allocation metrics reveal strong underlying fundamentals.
⚠️ Balance Sheet & Leverage Analysis
A robust analysis of the balance sheet ratios provides insights into the company's financial leverage and liquidity position, critical for evaluating financial health.
| Year | 2025 | 2024 | 2023 |
|---|---|---|---|
| Debt-to-Equity | 81.20% | 88.17% | 100.51% |
| Debt-to-Assets | 31.97% | 32.47% | 33.63% |
| Debt-to-Capital | 44.81% | 46.86% | 50.13% |
| Net Debt to EBITDA | 2.91 | 3.77 | 5.22 |
| Current Ratio | 1.01 | 0.99 | 1.01 |
| Quick Ratio | 1.01 | 0.99 | 1.01 |
| Financial Leverage | 2.54 | 2.72 | 2.99 |
The company's leverage is elevated, indicating reliance on debt, but robust liquidity ratios suggest sound coverage and potential risk mitigation capabilities.
🗣️ Fundamental Strength & Profitability
Key profitability metrics and their historical trends affirm the company's financial prowess and its ability to generate returns efficiently.
| Year | 2025 | 2024 | 2023 |
|---|---|---|---|
| Return on Equity | 14.63% | 9.98% | 9.79% |
| Return on Assets | 5.76% | 3.67% | 3.28% |
| Margins: Net | 21.77% | 15.09% | 17.46% |
| Margins: EBIT | 30.35% | 24.96% | 27.59% |
| Margins: EBITDA | 38.05% | 33.24% | 32.92% |
| Margins: Gross | 47.93% | 40.39% | 41.99% |
| R&D to Revenue | 0% | 0% | 0% |
The increasing return on equity and strong margins reflect Nasdaq's strengths in maintaining profitability and economic moat.
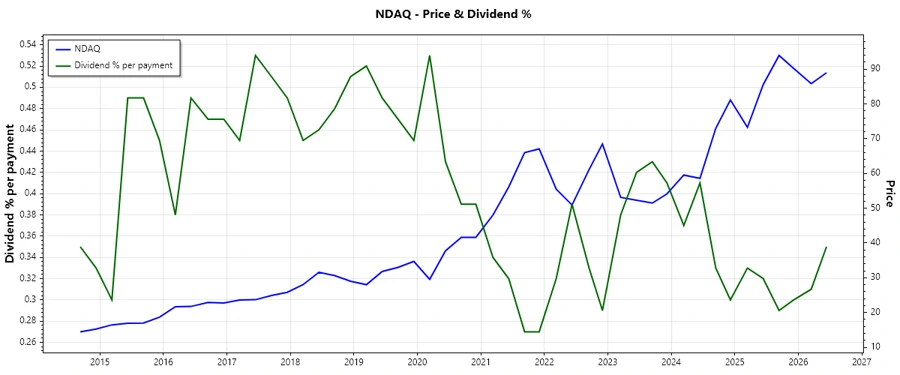
📈 Price Development
✅ Dividend Scoring System
| Criterion | Score | Score Bar |
|---|---|---|
| Dividend yield | 3 | |
| Dividend Stability | 4 | |
| Dividend growth | 3 | |
| Payout ratio | 5 | |
| Financial stability | 4 | |
| Dividend continuity | 4 | |
| Cashflow Coverage | 4 | |
| Balance Sheet Quality | 3 |
Total Score: 30/40
Rating
Nasdaq, Inc. exemplifies a strong dividend-paying profile with consistent growth and prudent financial management. While the dividend yield is moderate compared to peers, the payout ratios and financial stability underscore its capacity to sustain dividends. The company remains a solid candidate for dividend-focused portfolios seeking growth and consistency in income. Recommended as a hold for dividend portfolio diversification.
Smart Data Insight
Master the Perfect Entry & Exit for this Stock
Don't leave your profits to chance. Historically, this stock follows specific seasonal patterns that institutional traders use to maximize returns.
- ✅ Identify the "Golden Buying Window"
- ✅ Avoid high-risk correction cycles
- ✅ Backtested data from the last 20+ years