
April 24, 2026 a 02:46 am

NDAQ: Dividend Analysis - Nasdaq, Inc.
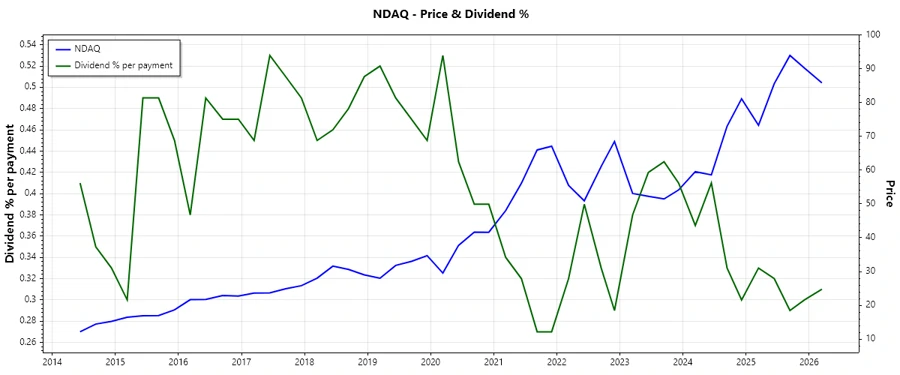
Nasdaq, Inc. showcases a stable dividend profile with a long history of returns to investors. The company manages to balance its payout ratio with growth perspectives, providing moderate yield while maintaining financial strength. With ongoing dividend growth over recent years, Nasdaq presents itself as a reliable choice for dividend investors seeking steady income.
Overview 📊
Nasdaq, Inc. operates in the Technology sector, delivering shareholder returns through consistent dividend payouts. The firm showcases a moderate dividend yield of 1.26%, and currently, the dividend per share stands at 1.05 USD. With 15 years of dividend history and no recent cuts or suspensions, Nasdaq stamps a reliable profile in terms of investor loyalty.
| Metric | Value |
|---|---|
| Sector | Technology |
| Dividend yield | 1.26 % |
| Current dividend per share | 1.05 USD |
| Dividend history | 15 years |
| Last cut or suspension | None |
Dividend History 📈
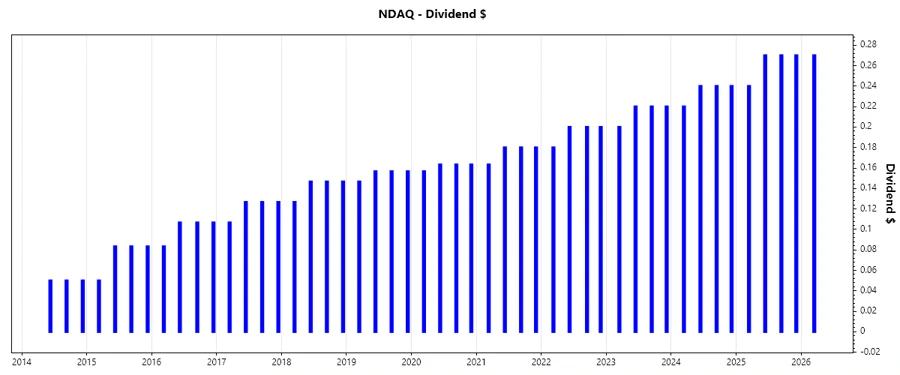
Understanding the history of dividend payments is crucial as it demonstrates a company's commitment to returning value to its shareholders. Nasdaq has shown resilience through financial cycles, maintaining stable dividends.
| Year | Dividend per Share (USD) |
|---|---|
| 2026 | 0.27 |
| 2025 | 1.05 |
| 2024 | 0.94 |
| 2023 | 0.86 |
| 2022 | 0.78 |
Dividend Growth 📈
Dividend growth is an essential indicator of a company's financial health and ability to return value over time. It suggests optimistic prospects and financial stability, reinforcing investor confidence.
| Time | Growth |
|---|---|
| 3 years | 10.42 % |
| 5 years | 10.18 % |
The average dividend growth is 10.18 % over 5 years. This shows moderate but steady dividend growth, implying ongoing efforts to enhance shareholder value.
Payout Ratio ✅
Payout ratios are critical to assess how much of the earnings are being paid out as dividends, revealing financial sustainability and flexibility for future projects or downturns.
| Key figure | Ratio |
|---|---|
| EPS-based | 31.53 % |
| Free cash flow-based | 30.10 % |
With an EPS-based payout of 31.53 % and a FCF-based payout of 30.10 %, Nasdaq presents a relatively low payout ratio, suggesting sustainable dividends and room for reinvestment and growth.
Cashflow & Capital Efficiency ⚖️
Cashflow and capital efficiency reflect a company's ability to generate returns on invested capital and manage operations effectively. A strong cashflow facilitates meeting obligations and sustaining dividends.
| Metric | 2025 | 2024 | 2023 |
|---|---|---|---|
| Free Cash Flow Yield | 3.59 % | 3.90 % | 5.20 % |
| Earnings Yield | 3.23 % | 2.51 % | 3.58 % |
| CAPEX to Operating Cash Flow | 11.80 % | 10.68 % | 9.31 % |
| Stock-based Compensation to Revenue | 2.01 % | 1.90 % | 2.01 % |
| Free Cash Flow / Operating Cash Flow Ratio | 88.20 % | 89.32 % | 90.68 % |
Nasdaq's cashflow metrics underscore its efficiency and capability to generate stable returns, supporting capital expenditure and sustaining dividends effectively.
Balance Sheet & Leverage Analysis 🔍
The balance sheet analysis evaluates the financial stability and leverage of a company, crucial for understanding its ability to cover its liabilities and sustain operations during economic fluctuations.
| Metric | 2025 | 2024 | 2023 |
|---|---|---|---|
| Debt-to-Equity | 0.81 | 0.88 | 1.01 |
| Debt-to-Assets | 32 % | 32 % | 34 % |
| Debt-to-Capital | 44.8 % | 46.9 % | 50.1 % |
| Net Debt to EBITDA | 2.82 | 3.77 | 5.22 |
| Current Ratio | 1.01 | 0.99 | 1.01 |
| Quick Ratio | 1.01 | 0.99 | 1.01 |
| Financial Leverage | 2.54 | 2.72 | 2.99 |
Nasdaq's leverage ratios indicate moderate levels of debt, underpinning financial stability with potential for growth through sustained financing operations.
Fundamental Strength & Profitability 💼
Assessing fundamental strength and profitability reveals a company's efficiency in resource utilization and ability to generate profits, essential for sustainable growth and investment return.
| Metric | 2025 | 2024 | 2023 |
|---|---|---|---|
| Return on Equity | 14.63 % | 9.98 % | 9.79 % |
| Return on Assets | 5.76 % | 3.67 % | 3.28 % |
| Margins: Net | 21.77 % | 15.09 % | 17.46 % |
| Margins: EBIT | 30.35 % | 24.96 % | 27.59 % |
| Margins: EBITDA | 38.05 % | 33.24 % | 32.92 % |
| Margins: Gross | 47.93 % | 40.39 % | 41.99 % |
| Research & Development to Revenue | 0 % | 0 % | 0 % |
Nasdaq's profitability analysis highlights efficient use of equity and assets, with strong margins pointing to effective cost management and revenue generation.
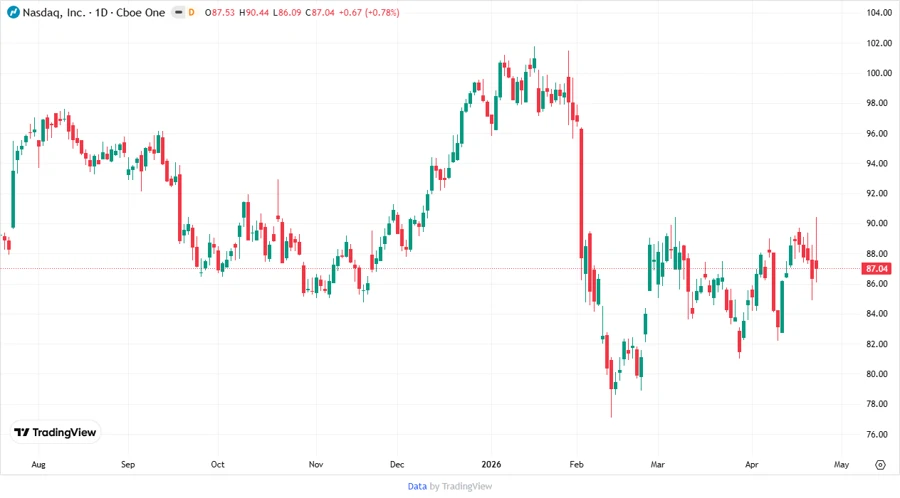
Price Development 📉
Dividend Scoring System 🏆
| Category | Score | Score Bar |
|---|---|---|
| Dividend yield | 3 | |
| Dividend Stability | 5 | |
| Dividend growth | 4 | |
| Payout ratio | 4 | |
| Financial stability | 4 | |
| Dividend continuity | 5 | |
| Cashflow Coverage | 4 | |
| Balance Sheet Quality | 4 |
Total Score: 33/40
Rating ⭐️
Nasdaq, Inc. maintains a strong dividend profile with solid fundamentals and profitability. Despite moderate yield, its consistent dividend track record and growth potential make it a compelling choice for income-focused investors. While challenges on leverage require attention, the overall financial stability is reassuring. We recommend Nasdaq as a stable investment with promising dividend prospects.
Smart Data Insight
Master the Perfect Entry & Exit for this Stock
Don't leave your profits to chance. Historically, this stock follows specific seasonal patterns that institutional traders use to maximize returns.
- ✅ Identify the "Golden Buying Window"
- ✅ Avoid high-risk correction cycles
- ✅ Backtested data from the last 20+ years