April 14, 2026 a 11:31 am


NDAQ: Dividend Analysis - Nasdaq, Inc.
With a modest dividend yield of 1.26%, Nasdaq, Inc. presents a stable dividend profile backed by a 15-year history of consecutive payments. The company exhibits moderate dividend growth momentum, supported by robust fundamentals and a disciplined approach to payout ratios, signaling a potentially rewarding opportunity for income-focused investors.
📊 Overview
Nasdaq, Inc. operates within a crucial sector of the financial markets. An analysis of its dividend yield reveals a figure of 1.26%, which, while relatively modest, is complemented by a strong current dividend per share of $1.05. The firm's commitment to dividends is further evidenced by a continuous payment history spanning 15 years, with no recent cuts or suspensions to report.
| Metric | Value |
|---|---|
| Sector | Financial Services |
| Dividend Yield | 1.26% |
| Current Dividend Per Share | $1.05 |
| Dividend History | 15 years |
| Last Cut or Suspension | None |
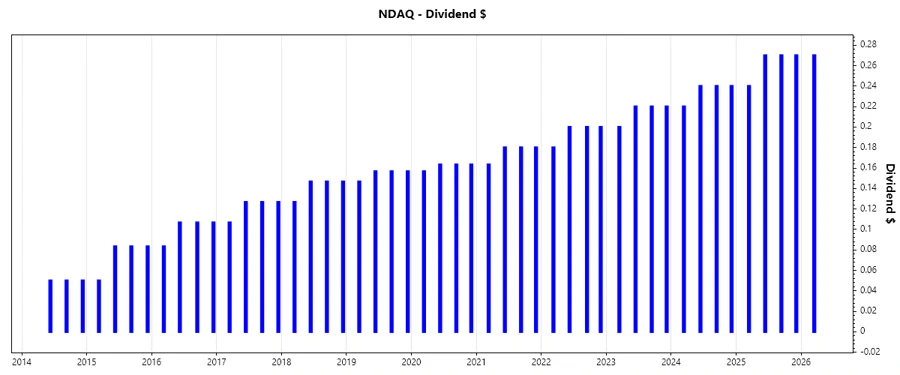
🗣️ Dividend History
The dividend history of Nasdaq, Inc. showcases its reliability and commitment to rewarding shareholders. Over recent years, the company has maintained a consistent upward trajectory in its dividend disbursements. This solid track record is crucial as it reflects management's confidence in the business's ongoing profitability and cash flow stability.
| Year | Dividend Per Share (USD) |
|---|---|
| 2026 | $0.27 |
| 2025 | $1.05 |
| 2024 | $0.94 |
| 2023 | $0.86 |
| 2022 | $0.78 |
📈 Dividend Growth
Analyzing Nasdaq, Inc.'s dividend growth rates provides insights into the firm's long-term financial strategy. A 3-year dividend growth rate of 10.42% and a 5-year rate of 10.18% indicate a steady increase in shareholder returns. This consistent growth suggests a controlled and sustainable dividend policy.
| Time | Growth |
|---|---|
| 3 years | 10.42% |
| 5 years | 10.18% |
The average dividend growth is 10.18% over 5 years. This shows moderate but steady dividend growth.
⚠️ Payout Ratio
Payout ratios reveal how much of the company's earnings are distributed to shareholders as dividends. Nasdaq, Inc. maintains a disciplined EPS-based payout ratio of 33.59% while the free cash flow-based ratio is at 30.23%. These figures indicate a conservative approach, allowing for reinvestment and growth.
| Key Figure | Ratio |
|---|---|
| EPS-based | 33.59% |
| Free cash flow-based | 30.23% |
The payout ratios signify an optimal balance between distribution and retention, supporting both shareholder returns and corporate growth initiatives.
💼 Cashflow & Capital Efficiency
Robust cash flow and efficient capital usage are pivotal for sustaining dividends. Nasdaq, Inc. showcases reliable free cash flow adequacy and capital allocation strategy, although variations in metrics like CAPEX influence certain yearly fluctuations.
| Key Metric | 2025 | 2024 | 2023 |
|---|---|---|---|
| Free Cash Flow Yield | 3.59% | 3.89% | 5.20% |
| Earnings Yield | 3.23% | 2.51% | 3.58% |
| CAPEX to Operating Cash Flow | 11.80% | 10.68% | 9.32% |
| Stock-based Compensation to Revenue | 2.00% | 1.91% | 2.01% |
| Free Cash Flow / Operating Cash Flow Ratio | 88.20% | 89.32% | 90.68% |
The robust cash flow profile underscores the company's capacity to deliver consistent dividends and invest in growth opportunities.
📉 Balance Sheet & Leverage Analysis
The balance sheet reflects Nasdaq, Inc.'s financial health and leverage levels, which are vital indicators of its ability to manage debt and maintain liquidity.
| Key Metric | 2025 | 2024 | 2023 |
|---|---|---|---|
| Debt-to-Equity | 0.81 | 0.88 | 1.01 |
| Debt-to-Assets | 0.32 | 0.33 | 0.34 |
| Debt-to-Capital | 0.45 | 0.47 | 0.50 |
| Net Debt to EBITDA | 2.91 | 3.77 | 5.22 |
| Current Ratio | 1.01 | 0.99 | 1.01 |
| Quick Ratio | 1.01 | 0.99 | 1.01 |
| Financial Leverage | 2.54 | 2.72 | 2.99 |
Nasdaq, Inc. demonstrates a well-managed leverage profile, coupled with adequate liquidity to cover short-term obligations, reflecting prudent capital management.
✅ Fundamental Strength & Profitability
Fundamental analysis highlights how Nasdaq, Inc. capitalizes on its resources to drive profitability — essential for sustained dividend payments.
| Key Metric | 2025 | 2024 | 2023 |
|---|---|---|---|
| Return on Equity | 14.63% | 9.98% | 9.79% |
| Return on Assets | 5.76% | 3.67% | 3.28% |
| Margins: Net | 21.77% | 15.09% | 17.46% |
| Margins: EBIT | 30.35% | 24.96% | 27.59% |
| Margins: EBITDA | 38.05% | 33.24% | 32.92% |
| Margins: Gross | 47.93% | 40.39% | 41.99% |
| R&D to Revenue | 0% | 0% | 0% |
Nasdaq, Inc. carves a strong profitability trajectory, with efficient operational capabilities driving consistent results.
📊 Price Development
Dividend Scoring System
| Criteria | Score (1-5) | Score Bar |
|---|---|---|
| Dividend yield | 3 | |
| Dividend Stability | 5 | |
| Dividend growth | 4 | |
| Payout ratio | 5 | |
| Financial stability | 4 | |
| Dividend continuity | 5 | |
| Cashflow Coverage | 4 | |
| Balance Sheet Quality | 3 |
Total Score: 33/40
Rating
In conclusion, Nasdaq, Inc. presents a compelling dividend investment opportunity. The company's disciplined financial management, steady growth trajectory, and commendable payout ratios underscore its capability to offer sustainable dividends while pursuing growth strategies. Investors seeking income and stability may find Nasdaq, Inc. an attractive addition to their portfolios.