
March 02, 2026 a 07:46 am



NDAQ: Dividend Analysis - Nasdaq, Inc.
Nasdaq, Inc., a formidable player in the stock market sector, presents a stable dividend profile, reflecting its commitment to shareholder returns. The company has consistently increased its dividends for the past 15 years, showcasing a robust financial framework and leveraged position. Investors might find the moderate dividend yield and solid growth over the years a persuasive reason to include it in a dividend-focused portfolio.
📊 Overview
Nasdaq operates in the Technology Services sector, offering a competitive dividend yield of 1.23%. With a current dividend of $1.05 per share and 15 consecutive years of dividend history, it demonstrates a strong shareholder return policy. Notably, there have been no recent dividend cuts or suspensions, highlighting consistent financial health.
| Category | Details |
|---|---|
| Sector | Technology Services |
| Dividend Yield | 1.23% |
| Current Dividend per Share | $1.05 |
| Dividend History | 15 years |
| Last Cut or Suspension | None |
🗣️ Dividend History
The prolonged dividend payment history of Nasdaq underlines its reliability and commitment to returns, pivotal for income-focused investors. Evaluating the consistency and trends in dividend payments can reveal insights into the firm's financial prudence and future payout potential.
| Year | Dividend per Share (USD) |
|---|---|
| 2026 | 0.27 |
| 2025 | 1.05 |
| 2024 | 0.94 |
| 2023 | 0.86 |
| 2022 | 0.78 |
📈 Dividend Growth
Tracking dividend growth is critical for determining a company's capacity to increase shareholder rewards over time. Nasdaq's 3-year growth at 10.42% and 5-year growth at 10.18% indicate consistent escalation in dividend payouts. This moderate but steady growth suggests ongoing company profitability and prudent fiscal management.
| Time | Growth |
|---|---|
| 3 years | 10.42% |
| 5 years | 10.18% |
The average dividend growth is 10.18% over 5 years. This shows moderate but steady dividend growth.
⚠️ Payout Ratio
Payout ratios offer insight into the sustainability of a company's dividends. An EPS-based payout ratio of 33.59% and a free cash flow-based payout ratio of 30.23% suggest Nasdaq maintains adequate cash reserves to cover its dividends while also investing in business growth.
| Key Figure | Ratio |
|---|---|
| EPS-based | 33.59% |
| Free cash flow-based | 30.23% |
The modest payout ratios illustrate smart financial practices, allowing for both return distribution and internal growth funding, ensuring long-term investment viability.
✅ Cashflow & Capital Efficiency
Thorough cash flow management is vital for dividend reliability and corporate strength. With a free cash flow yield of 3.98% and a solid earnings yield, Nasdaq is poised for sustainable growth while efficiently managing CAPEX and stock-based compensation relative to revenue.
| Measure | 2025 | 2024 | 2023 |
|---|---|---|---|
| Free Cash Flow Yield | 3.59% | 3.90% | 5.20% |
| Earnings Yield | 3.23% | 2.51% | 3.58% |
| CAPEX to Operating Cash Flow | 11.80% | 10.67% | 9.32% |
| Stock-based Compensation to Revenue | 2.01% | 1.91% | 2.01% |
| Free Cash Flow / Operating Cash Flow Ratio | 88.20% | 89.32% | 90.68% |
This financial landscape indicates robust cash flow generation and prudent capital allocation policies, contributing significantly to Nasdaq's long-standing fiscal health and growth trajectory.
💼 Balance Sheet & Leverage Analysis
Analyzing leverage ratios and the balance sheet offers a peek into a company's debt management and liquidity position. With favorable debt-to-equity and quick ratios, Nasdaq demonstrates financial robustness and liquidity adequacy. Interest coverage ratios underline the ability to service debt efficiently.
| Metric | 2025 | 2024 | 2023 |
|---|---|---|---|
| Debt-to-Equity | 0.81 | 0.88 | 1.01 |
| Debt-to-Assets | 0.32 | 0.32 | 0.34 |
| Debt-to-Capital | 0.45 | 0.47 | 0.50 |
| Net Debt to EBITDA | 2.91 | 3.77 | 5.22 |
| Current Ratio | 1.00 | 0.99 | 1.01 |
| Quick Ratio | 1.00 | 0.98 | 1.01 |
| Financial Leverage | 2.54 | 2.72 | 2.99 |
The metrics suggest a prudent debt utilization strategy and strong financial leverage, providing Nasdaq with stable financial groundwork from which it can strategically expand.
📈 Fundamental Strength & Profitability
Profitability ratios like return on equity and asset margins offer insights into efficiency and value generation. Nasdaq's consistent margins and returns on equity and assets highlight competent management and strategic growth execution.
| Indicator | 2025 | 2024 | 2023 |
|---|---|---|---|
| Return on Equity | 14.63% | 9.98% | 9.79% |
| Return on Assets | 5.76% | 3.67% | 3.28% |
| Margins: Net | 21.77% | 15.09% | 17.46% |
| EBIT Margin | 30.35% | 24.96% | 27.59% |
| EBITDA Margin | 38.05% | 33.24% | 32.92% |
| Gross Margin | 47.93% | 40.39% | 41.99% |
| Research & Development to Revenue | 0% | 0% | 0% |
These metrics collectively confirm Nasdaq's strong fundamental health and adept profitability management, reinforcing its market position and ongoing investor appeal.
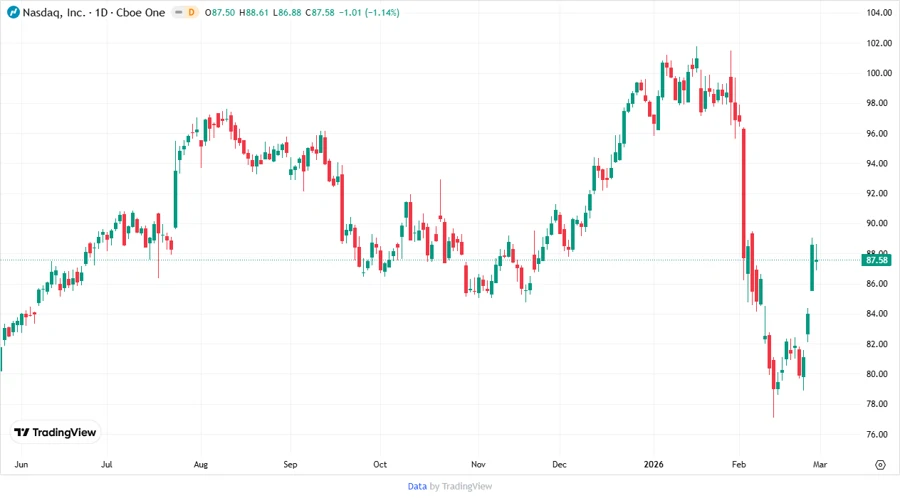
📈 Price Development
📉 Dividend Scoring System
| Criteria | Score | Score Bar |
|---|---|---|
| Dividend Yield | 3 | |
| Dividend Stability | 5 | |
| Dividend Growth | 4 | |
| Payout Ratio | 4 | |
| Financial Stability | 4 | |
| Dividend Continuity | 5 | |
| Cashflow Coverage | 4 | |
| Balance Sheet Quality | 4 |
Overall Score: 33/40
📊 Rating
In conclusion, Nasdaq, Inc. exhibits a strong dividend profile characterized by stability and growth, supported by sound financial metrics and strategic capital management. Considering the well-rounded dividend score, Nasdaq is a compelling pick for dividend-seeking investors seeking reliability with growth potential.
Smart Data Insight
Master the Perfect Entry & Exit for this Stock
Don't leave your profits to chance. Historically, this stock follows specific seasonal patterns that institutional traders use to maximize returns.
- ✅ Identify the "Golden Buying Window"
- ✅ Avoid high-risk correction cycles
- ✅ Backtested data from the last 20+ years