December 01, 2025 a 03:31 pm


NDAQ: Dividend Analysis - Nasdaq, Inc.
The dividend analysis of Nasdaq, Inc. exhibits a solid yet strategic payout approach. With consistent dividend distribution over 14 years, this reflects a robust commitment to shareholders. The absence of recent cuts or suspensions underscores financial stability, complemented by competitive payout ratios that balance reinvestment and shareholder returns. Moderate yet steady growth indicates potential for long-term income generation.
📊 Overview
Nasdaq, Inc. stands out with a respectable dividend yield of 1.15%. The company has been consistently delivering dividends for the past 14 years, highlighting its commitment to returning value to shareholders. The last cut or suspension is noted as 'None', further reinforcing the reliability of Nasdaq as a dividend-paying stock.
| Metric | Value |
|---|---|
| Sector | Financial |
| Dividend yield | 1.15 % |
| Current dividend per share | 0.94 USD |
| Dividend history | 14 years |
| Last cut or suspension | None |
📈 Dividend History
The dividend history of Nasdaq, Inc. emphasizes its strategic consistency over 14 years with a progressive increase in payouts. This reflects sustainable financial health and management confidence. Examining this history is critical in evaluating the company's resilience during economic downturns and its capacity to enhance shareholder value across varying market conditions.
| Year | Dividend per Share (USD) |
|---|---|
| 2025 | 1.05 |
| 2024 | 0.94 |
| 2023 | 0.86 |
| 2022 | 0.78 |
| 2021 | 0.70 |
📈 Dividend Growth
The three and five-year growth rates of 10.15% and 8.80% respectively illustrate a modest yet discernible upwards trajectory in shareholder returns. Monitoring dividend growth rates is pivotal as it often precedes potential increases in share price, enhancing overall investment returns through compounded growth.
| Time | Growth |
|---|---|
| 3 years | 10.15 % |
| 5 years | 8.80 % |
The average dividend growth is 8.80% over 5 years. This shows moderate but steady dividend growth.
✅ Payout Ratio
With an EPS-based payout ratio of 33.19% and a free cash flow-based payout ratio of 25.75%, Nasdaq maintains a disciplined approach in distributing profits. These figures indicate ample room for reinvestment and future dividend hikes, while safeguarding against overextension amidst market volatility.
| Key figure | Ratio |
|---|---|
| EPS-based | 33.19 % |
| Free cash flow-based | 25.75 % |
An EPS payout ratio of 33.19% and FCF payout ratio of 25.75% suggest a healthy balance between rewarding investors and retaining earnings for growth.
🗣️ Cashflow & Capital Efficiency
Examining cash flows and capital efficiency highlights Nasdaq's capabilities in generating and judiciously allocating financial resources. With solid figures across free cash flow and earnings yield, the company demonstrates robust operational efficiency, further backed by judicious capital expenditures.
| Metric | 2024 | 2023 | 2022 |
|---|---|---|---|
| Free Cash Flow Yield | 3.90 % | 5.20 % | 5.14 % |
| Earnings Yield | 2.51 % | 3.58 % | 3.72 % |
| CAPEX to Operating Cash Flow | 10.15 % | 9.32 % | 8.91 % |
| Stock-based Compensation to Revenue | 1.90 % | 2.01 % | 1.70 % |
| Free Cash Flow / Operating Cash Flow Ratio | 89.32 % | 90.68 % | 91.09 % |
Solid free cash flow and earnings yield ratios reinforce Nasdaq's adept cash management and capacity for sustained capital efficiency.
🏛️ Balance Sheet & Leverage Analysis
Nasdaq's balance sheet analysis reveals a strategically managed debt position with predictable leverage, conducive to stability and growth. The debt-to-equity and other leverage ratios provide insights into financial health, indicating judicious debt management aligned with long-term strategic goals.
| Metric | 2024 | 2023 | 2022 |
|---|---|---|---|
| Debt-to-Equity | 0.88 | 1.01 | 0.95 |
| Debt-to-Assets | 32.47 % | 33.66 % | 28.04 % |
| Debt-to-Capital | 46.86 % | 50.13 % | 48.75 % |
| Net Debt to EBITDA | 3.77 | 5.22 | 2.89 |
| Current Ratio | 0.98 | 1.01 | 0.97 |
| Quick Ratio | 0.98 | 1.00 | 0.97 |
These leverage metrics, including a debt-to-equity ratio of around 1.00, reflect Nasdaq's focus on balancing debt levels with operational liquidity to sustain growth.
🔍 Fundamental Strength & Profitability
Assessing fundamental strength and profitability uncovers Nasdaq's core operational efficacy marked by favorable returns on equity and assets, alongside solid profit margins. These metrics showcase robust internal efficiencies and proficient capital deployment, essential for long-term value creation.
| Metric | 2024 | 2023 | 2022 |
|---|---|---|---|
| Return on Equity | 9.98 % | 9.79 % | 18.29 % |
| Return on Assets | 3.67 % | 3.28 % | 5.39 % |
| Net Margin | 15.09 % | 17.46 % | 18.07 % |
| EBIT Margin | 24.96 % | 27.59 % | 25.62 % |
| EBITDA Margin | 33.24 % | 32.92 % | 29.76 % |
| Research & Development to Revenue | 0.00 % | 0.00 % | 0.00 % |
Consistent returns on equity, alongside healthy margins, affirm Nasdaq’s profitability and strong market positioning.
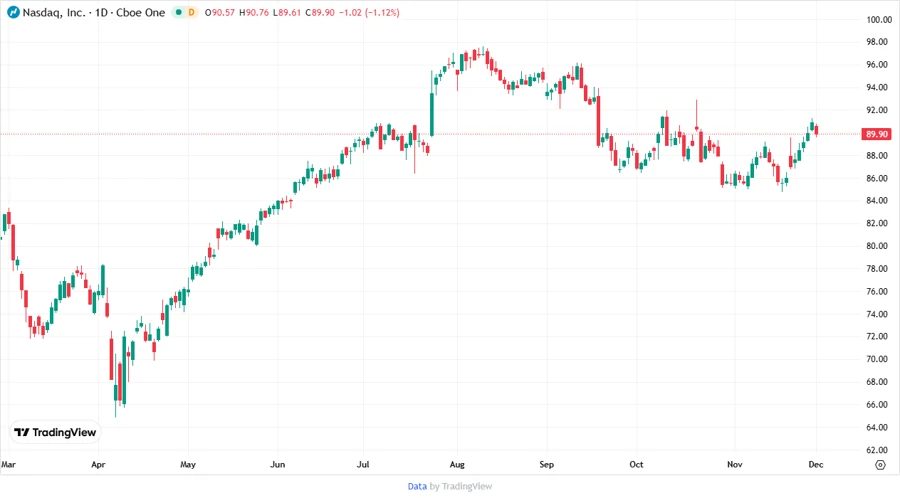
🚀 Price Development
🆙 Dividend Scoring System
This scoring system provides a comprehensive evaluation of Nasdaq’s dividend performance across vital financial criteria. Each category is rated on a scale of 1 to 5 for a maximum score of 40 points.
| Category | Score (1-5) | Score Bar |
|---|---|---|
| Dividend yield | 3 | |
| Dividend Stability | 5 | |
| Dividend growth | 4 | |
| Payout ratio | 4 | |
| Financial stability | 4 | |
| Dividend continuity | 5 | |
| Cashflow Coverage | 4 | |
| Balance Sheet Quality | 4 |
Overall Score: 33/40
📉 Rating
Nasdaq, Inc. presents a strong dividend proposition with its continuous dividend history and strategic payout ratios. The moderate yet consistent growth reflects a prudent management strategy, offering investors a reliable income source combined with potential appreciation. It is a worthy candidate for income-focused portfolios seeking stability and gradual growth.