July 28, 2025 a 11:31 am


NDAQ: Dividend Analysis - Nasdaq, Inc.
Nasdaq, Inc. presents a steady dividend profile characterized by consistent growth and prudent payout ratios. With a solid presence in the financial sector, its focus on sustainable earnings makes it a noteworthy option for dividend-seeking investors. The company's strategic financial management reflects in its moderate dividend yield and long-term growth potential.
📊 Overview
Nasdaq, Inc. operates in the financial sector with a particular strength in global securities trading. The current dividend yield stands at 1.08%, with a current dividend per share of $0.94 and a robust dividend payment history spanning 14 years. Encouragingly, there have been no recent dividend cuts or suspensions, highlighting the firm's commitment to shareholder returns.
| Metric | Value |
|---|---|
| Sector | Financials |
| Dividend yield | 1.08% |
| Current dividend per share | $0.94 |
| Dividend history | 14 years |
| Last cut or suspension | None |
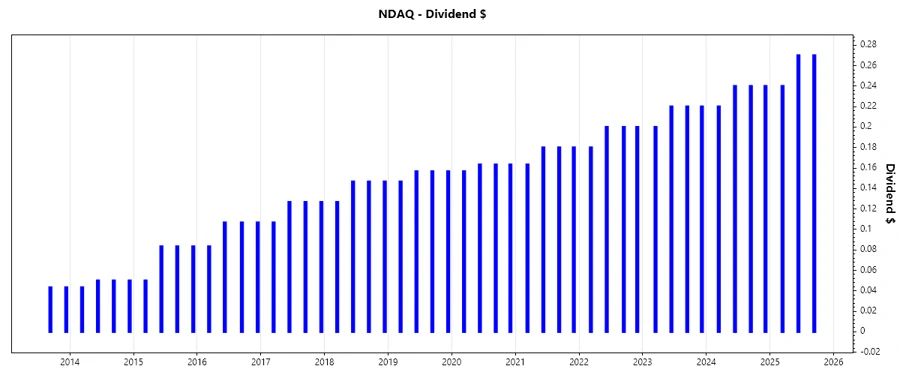
📈 Dividend History
A strong dividend history indicates the reliability of a company's distributions to shareholders. Consistency in dividends over the years is indicative of good financial health and management's commitment to shareholder value.
| Year | Dividend per Share (USD) |
|---|---|
| 2025 | $0.78 |
| 2024 | $0.94 |
| 2023 | $0.86 |
| 2022 | $0.78 |
| 2021 | $0.70 |
📈 Dividend Growth
Dividend growth reflects a company's ability to generate increasing shareholder returns over time. This is a crucial metric for assessing the future potential of dividends, reinforcing the company's financial strength.
| Time | Growth |
|---|---|
| 3 years | 10.15% |
| 5 years | 8.80% |
The average dividend growth is 8.80% over 5 years. This shows moderate but steady dividend growth, providing investors with confidence in the sustainability of their dividend income.
📉 Payout Ratio
Payout ratios are indicative of how much profit is returned to shareholders as dividends. A lower payout ratio suggests a company is retaining earnings for growth while maintaining a buffer to sustain dividends even during economic downturns.
| Key Figure | Ratio |
|---|---|
| EPS-based | 35.81% |
| Free cash flow-based | 29.11% |
With a 35.81% EPS payout ratio and a 29.11% free cash flow payout ratio, Nasdaq, Inc. demonstrates a prudent approach to dividend payments, ensuring stability and room for potential future growth.
🗣️ Cashflow & Capital Efficiency
Cash flow and capital efficiency indicators are vital in determining a company's capacity to sustain dividends. They highlight the quality of earnings and the firm's ability to reinvest for growth.
| Year | 2024 | 2023 | 2022 |
|---|---|---|---|
| Free Cash Flow Yield | 3.90% | 5.20% | 5.14% |
| Earnings Yield | 2.51% | 3.58% | 3.72% |
| CAPEX to Operating Cash Flow | 10.67% | 9.32% | 8.91% |
| Stock-based Compensation to Revenue | 1.91% | 2.01% | 1.70% |
| Free Cash Flow / Operating Cash Flow Ratio | 89.32% | 90.68% | 91.09% |
Nasdaq, Inc.'s high operating to free cash flow conversion rates suggest efficient cash management, enhancing dividend sustainability as well as capital reinvestment opportunities.
⚠️ Balance Sheet & Leverage Analysis
The balance sheet and leverage ratios underline a firm's financial health. Understanding these can help assess potential risks regarding the company's obligations.
| Year | 2024 | 2023 | 2022 |
|---|---|---|---|
| Debt-to-Equity | 0.88 | 1.01 | 0.95 |
| Debt-to-Assets | 0.32 | 0.34 | 0.28 |
| Debt-to-Capital | 0.47 | 0.50 | 0.49 |
| Net Debt to EBITDA | 3.62 | 5.22 | 2.74 |
| Current Ratio | 0.99 | 1.01 | 0.97 |
| Quick Ratio | 0.99 | 1.01 | 0.18 |
Nasdaq, Inc. maintains a manageable level of debt, as reflected in its leverage measures, indicating a balanced risk profile suitable for sustaining its continued focus on dividend delivery.
✅ Fundamental Strength & Profitability
Fundamental strength and profitability ratios provide insight into a company's ability to generate earnings from its assets.
| Year | 2024 | 2023 | 2022 |
|---|---|---|---|
| Return on Equity | 9.98% | 9.79% | 18.29% |
| Return on Assets | 3.67% | 3.28% | 5.39% |
| Net Profit Margin | 15.09% | 17.46% | 18.07% |
| EBIT Margin | 24.96% | 27.59% | 25.62% |
| EBITDA Margin | 34.62% | 32.92% | 31.35% |
The solid profitability demonstrated by Nasdaq, Inc., as seen in its return metrics, underscores its capacity to generate sustainable earnings, essential for long-term dividend viability.
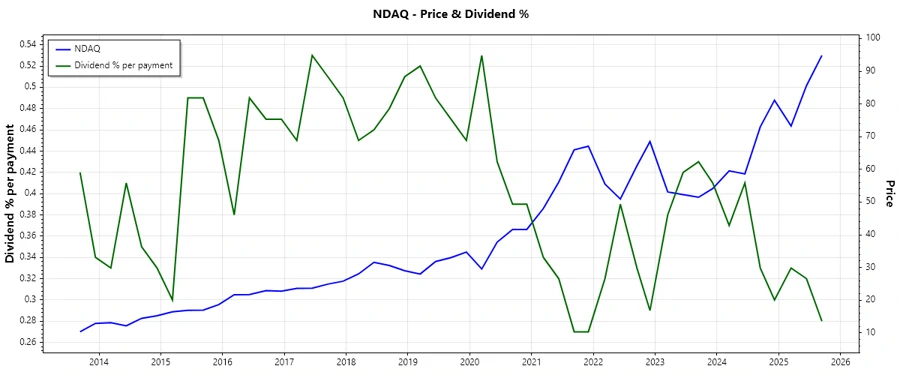
📉 Price Development
Dividend Scoring System
| Criteria | Score | Bar |
|---|---|---|
| Dividend yield | 3 | |
| Dividend Stability | 4 | |
| Dividend growth | 4 | |
| Payout ratio | 5 | |
| Financial stability | 4 | |
| Dividend continuity | 5 | |
| Cashflow Coverage | 4 | |
| Balance Sheet Quality | 4 |
Total Score: 33/40
🗣️ Rating
Nasdaq, Inc. is a solid choice for dividend investors looking for reliable income with clear evidence of steady growth prospects. With a strong financial foundation and prudent payout ratios, it offers both income potential and a level of security in its dividend payments.
Smart Data Insight
Master the Perfect Entry & Exit for this Stock
Don't leave your profits to chance. Historically, this stock follows specific seasonal patterns that institutional traders use to maximize returns.
- ✅ Identify the "Golden Buying Window"
- ✅ Avoid high-risk correction cycles
- ✅ Backtested data from the last 20+ years