March 01, 2026 a 09:03 am

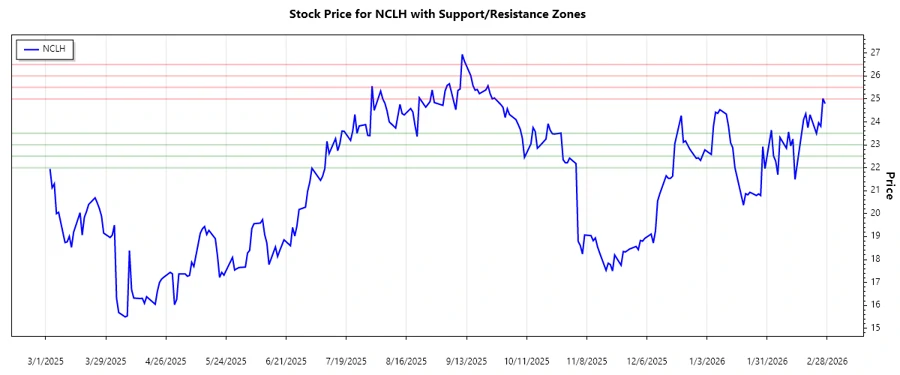
NCLH: Trend and Support & Resistance Analysis - Norwegian Cruise Line Holdings Ltd.
The stock of Norwegian Cruise Line Holdings Ltd. has shown resilience, navigating through economic challenges. Recent trends highlight fluctuations that indicate investor interests, with potential for both upward momentum and points of caution. The EMA analysis suggests a current market sentiment that traders should carefully monitor. Investors may find opportunities with calculated risks given the current support and resistance levels.
Trend Analysis
| Date | Closing Price | Trend |
|---|---|---|
| 2026-02-27 | 24.79 | ⚖️→ |
| 2026-02-26 | 25.02 | ⚖️→ |
| 2026-02-25 | 23.81 | ⚖️→ |
| 2026-02-24 | 23.96 | ⚖️→ |
| 2026-02-23 | 23.49 | ⚖️→ |
| 2026-02-20 | 24.31 | ⚖️→ |
| 2026-02-19 | 23.74 | ⚖️→ |
The current trend analysis based on the EMA indicates a neutral/sideways movement, suggesting market indecision. Traders should watch for confirming signals to determine the next trend move.
Support and Resistance
| Zone | From | To |
|---|---|---|
| Support 1 ↓ | 22.00 | 22.50 |
| Support 2 ↓ | 23.00 | 23.50 |
| Resistance 1 ↑ | 25.00 | 25.50 |
| Resistance 2 ↑ | 26.00 | 26.50 |
The price is currently positioned near the second support zone, highlighting a potential area for buyer interest. A break below could target lower support levels, while holding above might test the resistance zones.
Conclusion
The Norwegian Cruise Line Holdings Ltd. stock is currently showing a neutral trend, providing an opportunity for both bullish and bearish traders depending on movement out of the identified key zones. Investors should remain vigilant for breakout signals and pay attention to economic factors affecting the cruise industry. The current positioning near support could either offer a solid base for rebound or a risk of further decline if breached. Each scenario presents distinct opportunities and risks for the informed trader.