October 28, 2025 a 04:03 am

NCLH: Trend and Support & Resistance Analysis - Norwegian Cruise Line Holdings Ltd.
Norwegian Cruise Line Holdings Ltd. shows signs of flexibility and resilience in its diverse market operations. The recent analysis of the stock indicates potential areas of support and resistance, crucial for traders to consider. Current indicators show some fluctuation in the short-term trend, suggesting caution. Investors are advised to watch for sustained directional movements before making significant commitments.
Trend Analysis
| Date | Closing Price | Trend |
|---|---|---|
| 2025-10-27 | $23.51 | ▼ |
| 2025-10-24 | $23.47 | ⚖️ |
| 2025-10-23 | $23.48 | ▲ |
| 2025-10-22 | $23.63 | ▲ |
| 2025-10-21 | $23.92 | ▲ |
| 2025-10-20 | $23.25 | ▼ |
| 2025-10-17 | $22.94 | ▼ |
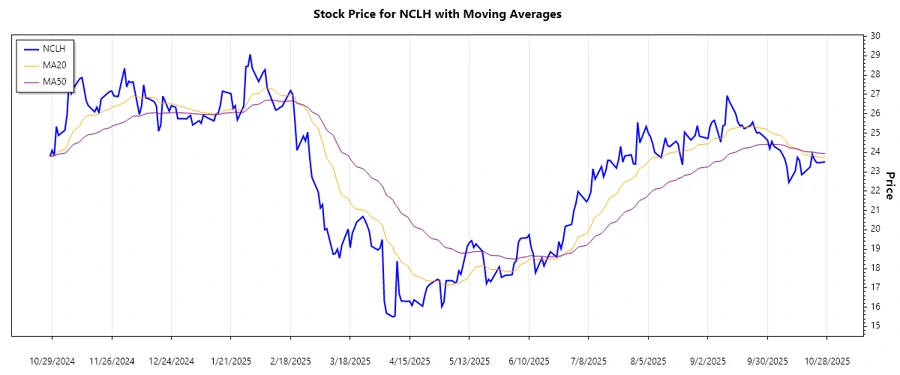
The current EMA20 below EMA50 indicates a persistent downward trend. Close attention should be paid for signs of correction or continuation in the near term.
Support and Resistance
| Zone | Level | Direction |
|---|---|---|
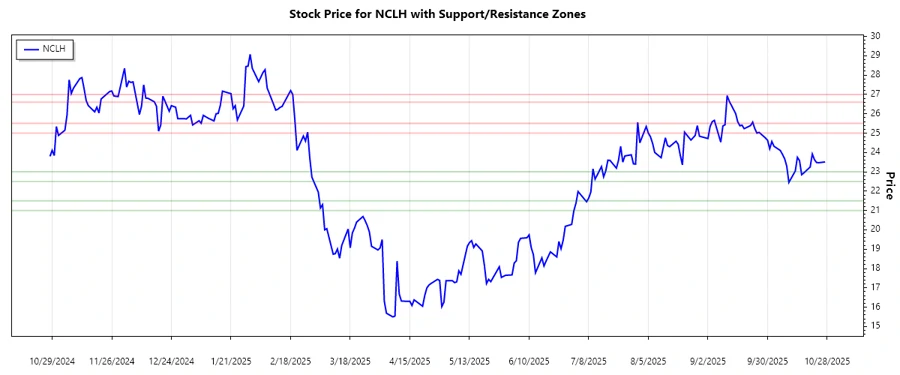
| Resistance 1 | $25.00 - $25.50 | ⬆️ |
| Resistance 2 | $26.60 - $27.00 | ⬆️ |
| Support 1 | $22.50 - $23.00 | ⬇️ |
| Support 2 | $21.00 - $21.50 | ⬇️ |
The current price of $23.51 sees itself floating around the first support zone. A break below would strengthen the bearish sentiment.
The stock is currently showing signs of a downward trend, with visible resistance levels that need overcoming for forward movement. Analysts should remain cautious and observe price movement around these critical levels. The areas of support identified imply possible zones where the stock may regain temporary strength. However, risk management strategies should be in place as prices test these key levels.
Smart Data Insight
Master the Perfect Entry & Exit for this Stock
Don't leave your profits to chance. Historically, this stock follows specific seasonal patterns that institutional traders use to maximize returns.
- ✅ Identify the "Golden Buying Window"
- ✅ Avoid high-risk correction cycles
- ✅ Backtested data from the last 20+ years