May 11, 2026 a 06:44 am

NCLH: Fibonacci Analysis - Norwegian Cruise Line Holdings Ltd.
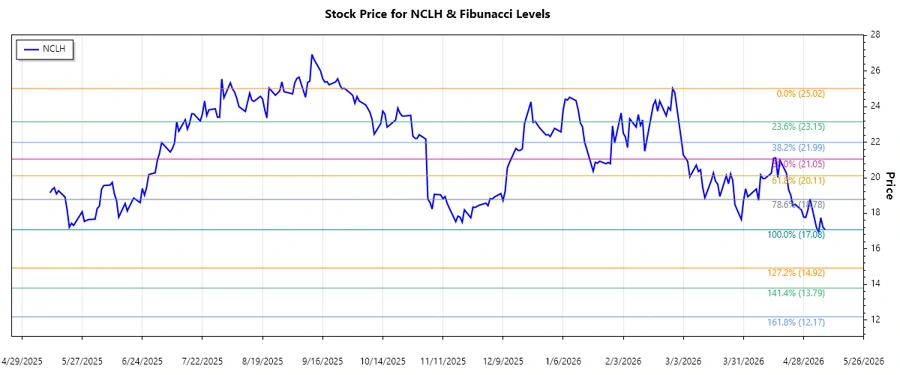
Norwegian Cruise Line Holdings Ltd. has experienced a significant decline in stock price over recent months, with macroeconomic uncertainties weighing heavily on the travel and tourism industry. While demand for cruises is poised to recover, escalating operational costs and stiff competition pose challenges. Nevertheless, strategic initiatives and potential market recovery could provide long-term opportunities.
Fibonacci Analysis
| Attribute | Value |
|---|---|
| Trend Type | Downtrend |
| Start Date | 2025-12-23 |
| End Date | 2026-05-08 |
| High Price & Date | $25.02 on 2026-02-26 |
| Low Price & Date | $17.08 on 2026-05-08 |
| Fibonacci Level | Price |
|---|---|
| 0.236 | $19.52 |
| 0.382 | $20.99 |
| 0.5 | $21.84 |
| 0.618 | $22.70 |
| 0.786 | $23.89 |
Currently, the stock is trading below a 0.236 retracement level, indicating continued bearish sentiment and the potential for further declines.
Technical analysis suggests that the $19.52 level could serve as a potential resistance if the stock price attempts an upward retracement, while the current low may act as a test for support.
Conclusion
The analysis of Norwegian Cruise Line Holdings Ltd. shows a marked downtrend, typifying wider sector challenges. The significant sell-off leaves room for strategic growth, but near-term pressures are evident. Investors should be cautious, acknowledging both resistance at key Fibonacci levels and potential support at lows. Long-term recovery prospects depend on macroeconomic conditions improving and demand normalization. Analysts remain vigilant, awaiting indicators of a sentiment shift which could influence price actions ahead.
Smart Data Insight
Master the Perfect Entry & Exit for this Stock
Don't leave your profits to chance. Historically, this stock follows specific seasonal patterns that institutional traders use to maximize returns.
- ✅ Identify the "Golden Buying Window"
- ✅ Avoid high-risk correction cycles
- ✅ Backtested data from the last 20+ years