September 10, 2025 a 06:44 am

NCLH: Fibonacci Analysis - Norwegian Cruise Line Holdings Ltd.
Norwegian Cruise Line Holdings Ltd. has shown resilience in the leisure and travel sector, with recovered demand post-pandemic aiding its performance. Recently, the stock exhibited noticeable price fluctuations, reflective of broader economic trends and consumer confidence. Investors should consider both the potential for growth in the cruise industry and the inherent risks associated with economic volatility. Technical analysis might offer insight into upcoming price movements. Let’s dive into the recent trend and conduct a Fibonacci analysis.
Fibonacci Analysis
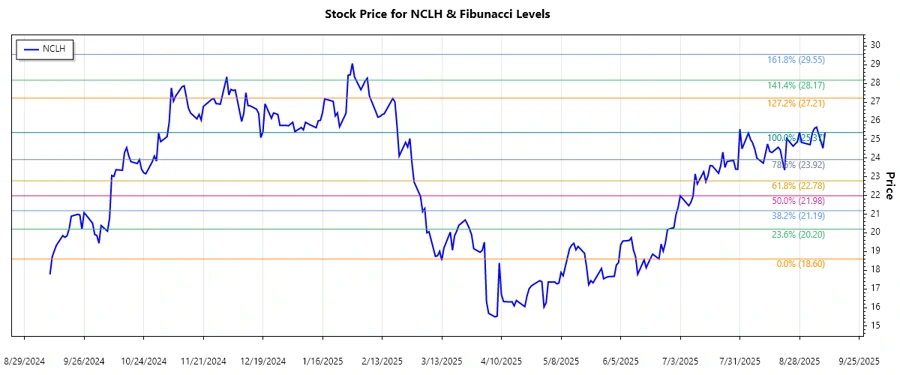
The recent data for NCLH indicates a dominant upward trend starting from mid-June 2025. The technical analysis highlights significant price levels that can provide insight into potential support and resistance zones.
| Parameter | Details |
|---|---|
| Trend Start Date | 2025-06-23 |
| Trend End Date | 2025-09-09 |
| High Point | $25.37 on 2025-09-09 |
| Low Point | $18.60 on 2025-06-23 |
Fibonacci Retracement Levels
| Level | Price |
|---|---|
| 0.236 | $23.85 |
| 0.382 | $22.66 |
| 0.5 | $21.98 |
| 0.618 | $21.30 |
| 0.786 | $20.32 |
Current analysis indicates the stock is trading near the 0.236 retracement level, suggesting potential resistance at this zone. Should the stock consolidate further, the 0.382 level may offer the next line of support.
Conclusion
As Norwegian Cruise Line Holdings Ltd. continues to navigate post-pandemic recovery, technical patterns suggest pivotal price levels. The stock's current positioning near the 0.236 Fibonacci level indicates a potential inflection point. While the broader industry outlook remains optimistic, some concern exists around economic fluctuations that could affect consumer travel decisions. Analysts will be keenly observing these technical levels for signs of breakout or consolidation, making it essential for investors to remain abreast of both price movements and macroeconomic factors affecting the cruise industry's rebound.
Smart Data Insight
Master the Perfect Entry & Exit for this Stock
Don't leave your profits to chance. Historically, this stock follows specific seasonal patterns that institutional traders use to maximize returns.
- ✅ Identify the "Golden Buying Window"
- ✅ Avoid high-risk correction cycles
- ✅ Backtested data from the last 20+ years