
August 02, 2025 a 11:44 am

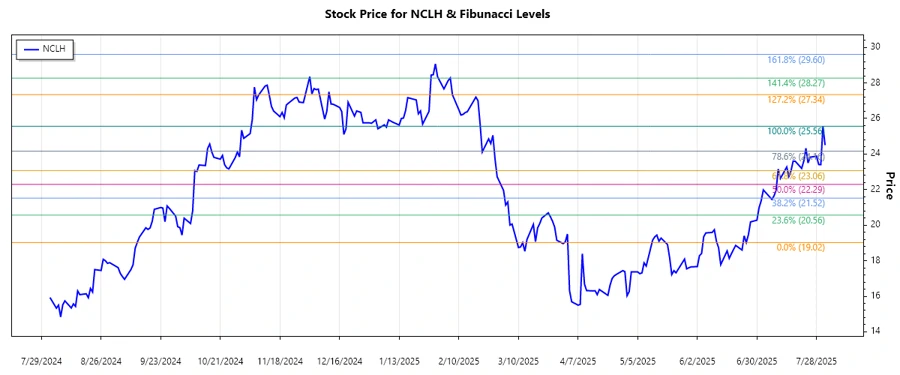
NCLH: Fibonacci Analysis - Norwegian Cruise Line Holdings Ltd.
Norwegian Cruise Line Holdings Ltd. has shown potential for recovery backed by increasing travel demand globally. Despite economic uncertainties, the company's diversified itineraries and strong brand recognition provide a growth opportunity. Recent price movements indicate a positive sentiment, though investors should remain cautious about potential market volatilities.
Fibonacci Analysis
| Details | Information |
|---|---|
| Trend Start Date | 2025-06-25 |
| Trend End Date | 2025-08-01 |
| High Price | $25.56 (2025-07-31) |
| Low Price | $19.02 (2025-06-25) |
| Fibonacci Level | Price Level |
|---|---|
| 0.236 | $23.90 |
| 0.382 | $22.88 |
| 0.5 | $22.29 |
| 0.618 | $21.70 |
| 0.786 | $20.73 |
The current price appears to be at $24.50, which indicates it's above the 0.236 retracement level, suggesting ongoing bullish momentum.
This can be technically interpreted as a potential support level at 0.236, which may guide future price movements if maintained.
Conclusion
Norwegian Cruise Line Holdings Ltd.'s price trend analysis suggests a strong upward trajectory with significant potential for trading profits. Fibonacci retracement levels highlight possible support that could sustain momentum, balancing risk with market exposure benefits. While the 0.236 level currently supports ongoing movement, attention should be paid to broader economic conditions affecting travel and tourism. Strategic position adjustments may optimize returns, leveraging market shifts observed in past performance.
Smart Data Insight
Master the Perfect Entry & Exit for this Stock
Don't leave your profits to chance. Historically, this stock follows specific seasonal patterns that institutional traders use to maximize returns.
- ✅ Identify the "Golden Buying Window"
- ✅ Avoid high-risk correction cycles
- ✅ Backtested data from the last 20+ years