
August 31, 2026 a 09:16 am


Material Stocks - Performance Analysis
The materials sector has exhibited a diverse range of performances over the recent periods. This analysis delves into the short, mid, and long-term performances of the sector's key stocks. Through an exploration of weekly, monthly, and quarterly data, we identify leading trends and key performers that are influencing market dynamics. Join us as we unveil the critical insights driving the materials sector today.
Material Stocks Performance One Week
| Stock | Performance (%) | Performance |
|---|---|---|
| CTVA | 1.33% | |
| APD | 0.61% | |
| DD | 0.25% | |
| ECL | -0.06% | |
| LIN | -0.10% | |
| MLM | -0.38% | |
| SHW | -0.53% | |
| FCX | -1.67% | |
| NEM | -2.86% |
Material Stocks Performance One Month
| Stock | Performance (%) | Performance |
|---|---|---|
| NEM | 32.41% | |
| FCX | 20.89% | |
| CTVA | 6.64% | |
| APD | 4.52% | |
| ECL | 3.36% | |
| SHW | 1.44% | |
| MLM | 1.41% | |
| DD | 0.27% | |
| LIN | 2.37% |
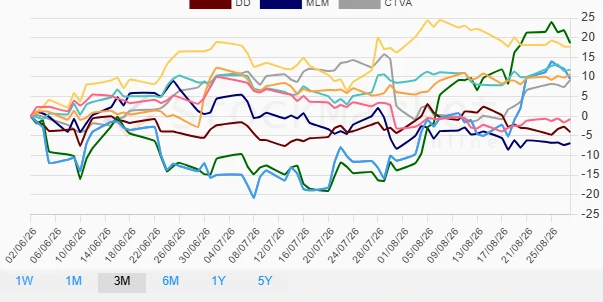
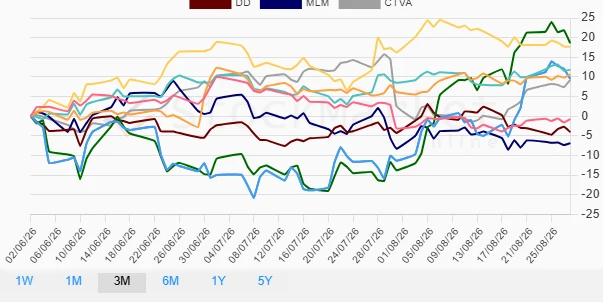
Material Stocks Performance Three Months
| Stock | Performance (%) | Performance |
|---|---|---|
| NEM | 18.63% | |
| SHW | 17.65% | |
| ECL | 11.85% | |
| APD | 10.68% | |
| FCX | 9.55% | |
| CTVA | 9.22% | |
| LIN | -0.73% | |
| DD | -4.01% | |
| MLM | -6.89% |
Summary
The materials sector has shown a mixed performance across the selected timeframes, with identifiable trends and standout performers. Over the past week, Corteva (CTVA) emerged as the most resilient, while Newmont (NEM) experienced the heaviest losses. In the monthly view, Newmont (NEM) showcased a remarkable recovery, leading its peers, overshadowed only by Freeport-McMoRan (FCX). In the quarterly analysis, both Sherwin-Williams (SHW) and Newmont (NEM) demonstrated significant strength, signaling a potential shift in investment opportunities. Overall, despite some short-term volatility, the sector has potential for appreciable returns in selective holdings.
Smart Data Insight
Master the Perfect Entry & Exit for this Stock
Don't leave your profits to chance. Historically, this stock follows specific seasonal patterns that institutional traders use to maximize returns.
- ✅ Identify the "Golden Buying Window"
- ✅ Avoid high-risk correction cycles
- ✅ Backtested data from the last 20+ years