September 29, 2025 a 09:17 am


Material Stocks - Performance Analysis
The materials sector has shown considerable volatility over recent periods, with performances ranging widely among top stocks. While certain stocks managed to yield positive gains, others faced significant declines, affected by macroeconomic conditions and sector-specific dynamics. Our analysis delves into the week-to-week, month-to-month, and three-month trends to identify both emerging leaders and those struggling within the sector.
📊 Material Stocks Performance One Week
Over the past week, stock performance in the materials sector was highly diverse. NEM emerged as a top performer with a 1.84% increase, demonstrating resilience amidst sector-wide challenges. Notably, FCX underperformed starkly with a -21.54% drop, signaling possible underlying issues. Our analysis identifies these pivotal movements, shedding light on the short-term market sentiment.
| Stock | Performance (%) | Performance |
|---|---|---|
| NEM | 1.84 | |
| ECL | 1.46 | |
| LIN | -0.69 | |
| MLM | -0.98 | |
| SHW | -1.30 | |
| CTVA | -2.32 | |
| DD | -2.62 | |
| APD | -7.35 | |
| FCX | -21.54 |
📊 Material Stocks Performance One Month
Over the last month, the materials sector exhibited a notable divergence. NEM posted a substantial gain of 13.87%, contrasting sharply with FCX's -19.46% drop. These movements underscore the heterogeneity within the sector and the varying influence of external market conditions on individual stocks.
| Stock | Performance (%) | Performance |
|---|---|---|
| NEM | 13.87 | |
| MLM | -0.32 | |
| LIN | -0.73 | |
| DD | -0.80 | |
| ECL | -2.10 | |
| SHW | -6.57 | |
| CTVA | -8.23 | |
| APD | -9.55 | |
| FCX | -19.46 |
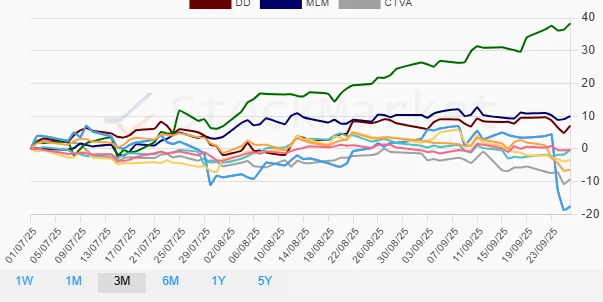
📊 Material Stocks Performance Three Months
In the three-month span, NEM's stellar performance with a 38.34% climb starkly contrasts with FCX, which continued its descent, closing the period down by 17.56%. Such disparities highlight the diverse responses within the sector to global economic pressures and internal operational strategies.
| Stock | Performance (%) | Performance |
|---|---|---|
| NEM | 38.34 | |
| MLM | 10.03 | |
| DD | 7.07 | |
| LIN | -0.28 | |
| ECL | -0.30 | |
| SHW | -3.33 | |
| APD | -6.32 | |
| CTVA | -9.27 | |
| FCX | -17.56 |
🔍 Summary
Across varying timeframes, the materials sector displayed significant diversity in stock performances, with NEM standing out as a consistent top performer, especially over the longer-term period. Conversely, FCX continuously underperformed, highlighting potential strategic or macroeconomic vulnerabilities. These findings emphasize the necessity for careful sector-specific analysis when considering investment strategies within the materials sector.
Smart Data Insight
Master the Perfect Entry & Exit for this Stock
Don't leave your profits to chance. Historically, this stock follows specific seasonal patterns that institutional traders use to maximize returns.
- ✅ Identify the "Golden Buying Window"
- ✅ Avoid high-risk correction cycles
- ✅ Backtested data from the last 20+ years